
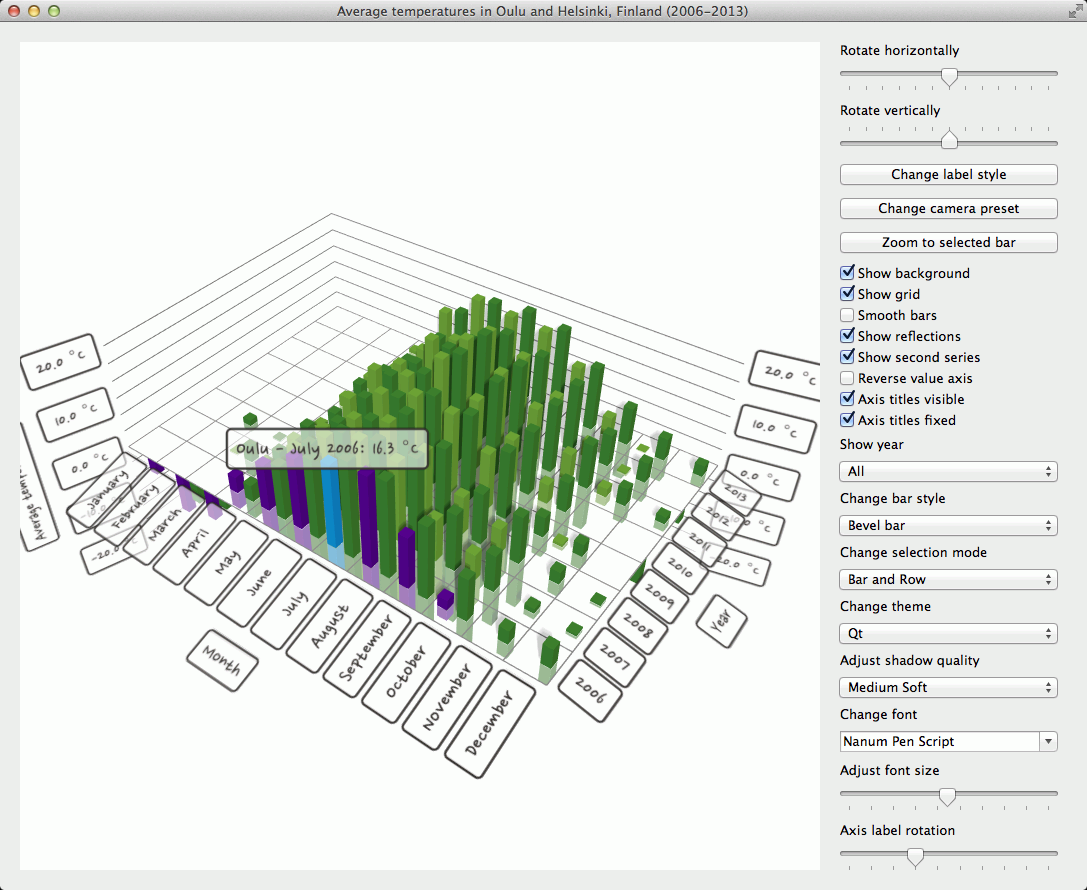
Bars Example
The bars example shows how to make a 3D bar graph using Q3DBars and combining the use of widgets for adjusting several adjustable qualities. The example shows how to:
- Create an application with Q3DBars and some widgets
- Use QBar3DSeries and QBarDataProxy to set data to the graph
- Adjust some graph and series properties using widget controls
- Select a row or a column by clicking an axis label
It also demonstrates how having negative bar values affects the graph.
For instructions about how to interact with the graph, see this page.
Running the Example
To run the example from Qt Creator, open the Welcome mode and select the example from Examples. For more information, visit Building and Running an Example.
Creating the Application
First, in main.cpp, we create a QApplication, instantiate Q3DBars and a window container for it:
QApplication app(argc, argv);
Q3DBars *widgetgraph = new Q3DBars();
QWidget *container = QWidget::createWindowContainer(widgetgraph);
The call to QWidget::createWindowContainer is required, as all data visualization graph classes (Q3DBars, Q3DScatter, Q3DSurface) inherit QWindow. Any class inheriting QWindow cannot be used as a widget any other way.
Then we'll create horizontal and vertical layouts. We'll add the graph and the vertical layout into the horizontal one:
QWidget *widget = new QWidget;
QHBoxLayout *hLayout = new QHBoxLayout(widget);
QVBoxLayout *vLayout = new QVBoxLayout();
hLayout->addWidget(container, 1);
hLayout->addLayout(vLayout);
We're not using the vertical layout for anything yet, but we'll get back to it in Using widgets to control the graph
Next, let's create another class to handle the data addition and other interaction with the graph. Let's call it GraphModifier (See Setting up the graph and Adding data to the graph for details):
GraphModifier *modifier = new GraphModifier(widgetgraph);
The application main is done and we can show the graph and start the event loop:
widget->show();
return app.exec();
Setting up the Graph
Let's set up the graph in the constructor of the GraphModifier class we instantiated in the application main:
GraphModifier::GraphModifier(Q3DBars *bargraph)
    : m_graph(bargraph),
      m_xRotation(0.0f),
      m_yRotation(0.0f),
      m_fontSize(30),
      m_segments(4),
      m_subSegments(3),
      m_minval(-20.0f),
      m_maxval(20.0f),
      m_temperatureAxis(new QValue3DAxis),
      m_yearAxis(new QCategory3DAxis),
      m_monthAxis(new QCategory3DAxis),
      m_primarySeries(new QBar3DSeries),
      m_secondarySeries(new QBar3DSeries),
      m_barMesh(QAbstract3DSeries::MeshBevelBar),
      m_smooth(false)
{
    m_graph->setShadowQuality(QAbstract3DGraph::ShadowQualitySoftMedium);
    m_graph->activeTheme()->setBackgroundEnabled(false);
    m_graph->activeTheme()->setFont(QFont("Times New Roman", m_fontSize));
    m_graph->activeTheme()->setLabelBackgroundEnabled(true);
    m_graph->setMultiSeriesUniform(true);

    m_months << "January" << "February" << "March" << "April" << "May" << "June" << "July" << "August" << "September" << "October" << "November" << "December";
    m_years << "2006" << "2007" << "2008" << "2009" << "2010" << "2011" << "2012" << "2013";

    m_temperatureAxis->setTitle("Average temperature");
    m_temperatureAxis->setSegmentCount(m_segments);
    m_temperatureAxis->setSubSegmentCount(m_subSegments);
    m_temperatureAxis->setRange(m_minval, m_maxval);
    m_temperatureAxis->setLabelFormat(QString(QStringLiteral("%.1f ") + celsiusString));
    m_temperatureAxis->setLabelAutoRotation(30.0f);
    m_temperatureAxis->setTitleVisible(true);

    m_yearAxis->setTitle("Year");
    m_yearAxis->setLabelAutoRotation(30.0f);
    m_yearAxis->setTitleVisible(true);
    m_monthAxis->setTitle("Month");
    m_monthAxis->setLabelAutoRotation(30.0f);
    m_monthAxis->setTitleVisible(true);

    m_graph->setValueAxis(m_temperatureAxis);
    m_graph->setRowAxis(m_yearAxis);
    m_graph->setColumnAxis(m_monthAxis);

    m_primarySeries->setItemLabelFormat(QStringLiteral("Oulu - @colLabel @rowLabel: @valueLabel"));
    m_primarySeries->setMesh(QAbstract3DSeries::MeshBevelBar);
    m_primarySeries->setMeshSmooth(false);

    m_secondarySeries->setItemLabelFormat(QStringLiteral("Helsinki - @colLabel @rowLabel: @valueLabel"));
    m_secondarySeries->setMesh(QAbstract3DSeries::MeshBevelBar);
    m_secondarySeries->setMeshSmooth(false);
    m_secondarySeries->setVisible(false);

    m_graph->addSeries(m_primarySeries);
    m_graph->addSeries(m_secondarySeries);

    changePresetCamera();

    resetTemperatureData();

    // Set up property animations for zooming to the selected bar
    Q3DCamera *camera = m_graph->scene()->activeCamera();
    m_defaultAngleX = camera->xRotation();
    m_defaultAngleY = camera->yRotation();
    m_defaultZoom = camera->zoomLevel();
    m_defaultTarget = camera->target();

    m_animationCameraX.setTargetObject(camera);
    m_animationCameraY.setTargetObject(camera);
    m_animationCameraZoom.setTargetObject(camera);
    m_animationCameraTarget.setTargetObject(camera);

    m_animationCameraX.setPropertyName("xRotation");
    m_animationCameraY.setPropertyName("yRotation");
    m_animationCameraZoom.setPropertyName("zoomLevel");
    m_animationCameraTarget.setPropertyName("target");

    int duration = 1700;
    m_animationCameraX.setDuration(duration);
    m_animationCameraY.setDuration(duration);
    m_animationCameraZoom.setDuration(duration);
    m_animationCameraTarget.setDuration(duration);

    // The zoom always first zooms out above the graph and then zooms in
    qreal zoomOutFraction = 0.3;
    m_animationCameraX.setKeyValueAt(zoomOutFraction, QVariant::fromValue(0.0f));
    m_animationCameraY.setKeyValueAt(zoomOutFraction, QVariant::fromValue(90.0f));
    m_animationCameraZoom.setKeyValueAt(zoomOutFraction, QVariant::fromValue(50.0f));
    m_animationCameraTarget.setKeyValueAt(zoomOutFraction,
                                          QVariant::fromValue(QVector3D(0.0f, 0.0f, 0.0f)));
}
Let's take a closer look at parts of the code.
First we're creating the axes and the series into member variables to support changing them easily later on, if we want to:
m_temperatureAxis(new QValue3DAxis),
m_yearAxis(new QCategory3DAxis),
m_monthAxis(new QCategory3DAxis),
m_primarySeries(new QBar3DSeries),
m_secondarySeries(new QBar3DSeries),
Then we're setting some of the visual qualities for the graph:
m_graph->setShadowQuality(QAbstract3DGraph::ShadowQualitySoftMedium);
m_graph->activeTheme()->setBackgroundEnabled(false);
m_graph->activeTheme()->setFont(QFont("Times New Roman", m_fontSize));
m_graph->activeTheme()->setLabelBackgroundEnabled(true);
m_graph->setMultiSeriesUniform(true);
We're also setting up the axes and setting them to the graph as active axes:
m_temperatureAxis->setTitle("Average temperature");
m_temperatureAxis->setSegmentCount(m_segments);
m_temperatureAxis->setSubSegmentCount(m_subSegments);
m_temperatureAxis->setRange(m_minval, m_maxval);
m_temperatureAxis->setLabelFormat(QString(QStringLiteral("%.1f ") + celsiusString));
m_temperatureAxis->setLabelAutoRotation(30.0f);
m_temperatureAxis->setTitleVisible(true);

m_yearAxis->setTitle("Year");
m_yearAxis->setLabelAutoRotation(30.0f);
m_yearAxis->setTitleVisible(true);
m_monthAxis->setTitle("Month");
m_monthAxis->setLabelAutoRotation(30.0f);
m_monthAxis->setTitleVisible(true);

m_graph->setValueAxis(m_temperatureAxis);
m_graph->setRowAxis(m_yearAxis);
m_graph->setColumnAxis(m_monthAxis);
We give axis labels a small autorotation angle to make them orient somewhat toward the camera. This is done to improve axis label readability at extreme camera angles.
Next we initialize the visual properties of the series. Note that the second series is initially not visible:
m_primarySeries->setItemLabelFormat(QStringLiteral("Oulu - @colLabel @rowLabel: @valueLabel"));
m_primarySeries->setMesh(QAbstract3DSeries::MeshBevelBar);
m_primarySeries->setMeshSmooth(false);

m_secondarySeries->setItemLabelFormat(QStringLiteral("Helsinki - @colLabel @rowLabel: @valueLabel"));
m_secondarySeries->setMesh(QAbstract3DSeries::MeshBevelBar);
m_secondarySeries->setMeshSmooth(false);
m_secondarySeries->setVisible(false);
The series need to be added to the graph to show them:
m_graph->addSeries(m_primarySeries);
m_graph->addSeries(m_secondarySeries);
Finally, we set the camera angle by calling the same method the camera angle change button in the UI uses to cycle through various camera angles:
changePresetCamera();
There you can see that the camera is controlled via the scene object of the graph:
static int preset = Q3DCamera::CameraPresetFront;

m_graph->scene()->activeCamera()->setCameraPreset((Q3DCamera::CameraPreset)preset);

if (++preset > Q3DCamera::CameraPresetDirectlyBelow)
    preset = Q3DCamera::CameraPresetFrontLow;
For more information about using scene and cameras, see Q3DScene and Q3DCamera.
That concludes setting up the graph.
Adding Data to the Graph
At the end of the constructor there's a call:
resetTemperatureData();
This method is used to add data to the proxies of the two series:
// Set up data
static const float tempOulu[8][12] = {
    {-6.7f, -11.7f, -9.7f, 3.3f, 9.2f, 14.0f, 16.3f, 17.8f, 10.2f, 2.1f, -2.6f, -0.3f},    // 2006
    {-6.8f, -13.3f, 0.2f, 1.5f, 7.9f, 13.4f, 16.1f, 15.5f, 8.2f, 5.4f, -2.6f, -0.8f},      // 2007
    {-4.2f, -4.0f, -4.6f, 1.9f, 7.3f, 12.5f, 15.0f, 12.8f, 7.6f, 5.1f, -0.9f, -1.3f},      // 2008
    {-7.8f, -8.8f, -4.2f, 0.7f, 9.3f, 13.2f, 15.8f, 15.5f, 11.2f, 0.6f, 0.7f, -8.4f},      // 2009
    {-14.4f, -12.1f, -7.0f, 2.3f, 11.0f, 12.6f, 18.8f, 13.8f, 9.4f, 3.9f, -5.6f, -13.0f},  // 2010
    {-9.0f, -15.2f, -3.8f, 2.6f, 8.3f, 15.9f, 18.6f, 14.9f, 11.1f, 5.3f, 1.8f, -0.2f},     // 2011
    {-8.7f, -11.3f, -2.3f, 0.4f, 7.5f, 12.2f, 16.4f, 14.1f, 9.2f, 3.1f, 0.3f, -12.1f},     // 2012
    {-7.9f, -5.3f, -9.1f, 0.8f, 11.6f, 16.6f, 15.9f, 15.5f, 11.2f, 4.0f, 0.1f, -1.9f}      // 2013
};

static const float tempHelsinki[8][12] = {
    {-3.7f, -7.8f, -5.4f, 3.4f, 10.7f, 15.4f, 18.6f, 18.7f, 14.3f, 8.5f, 2.9f, 4.1f},      // 2006
    {-1.2f, -7.5f, 3.1f, 5.5f, 10.3f, 15.9f, 17.4f, 17.9f, 11.2f, 7.3f, 1.1f, 0.5f},       // 2007
    {-0.6f, 1.2f, 0.2f, 6.3f, 10.2f, 13.8f, 18.1f, 15.1f, 10.1f, 9.4f, 2.5f, 0.4f},        // 2008
    {-2.9f, -3.5f, -0.9f, 4.7f, 10.9f, 14.0f, 17.4f, 16.8f, 13.2f, 4.1f, 2.6f, -2.3f},     // 2009
    {-10.2f, -8.0f, -1.9f, 6.6f, 11.3f, 14.5f, 21.0f, 18.8f, 12.6f, 6.1f, -0.5f, -7.3f},   // 2010
    {-4.4f, -9.1f, -2.0f, 5.5f, 9.9f, 15.6f, 20.8f, 17.8f, 13.4f, 8.9f, 3.6f, 1.5f},       // 2011
    {-3.5f, -3.2f, -0.7f, 4.0f, 11.1f, 13.4f, 17.3f, 15.8f, 13.1f, 6.4f, 4.1f, -5.1f},     // 2012
    {-4.8f, -1.8f, -5.0f, 2.9f, 12.8f, 17.2f, 18.0f, 17.1f, 12.5f, 7.5f, 4.5f, 2.3f}       // 2013
};

// Create data arrays
QBarDataArray *dataSet = new QBarDataArray;
QBarDataArray *dataSet2 = new QBarDataArray;
QBarDataRow *dataRow;
QBarDataRow *dataRow2;

dataSet->reserve(m_years.size());
for (int year = 0; year < m_years.size(); year++) {
    // Create a data row
    dataRow = new QBarDataRow(m_months.size());
    dataRow2 = new QBarDataRow(m_months.size());
    for (int month = 0; month < m_months.size(); month++) {
        // Add data to the row
        (*dataRow)[month].setValue(tempOulu[year][month]);
        (*dataRow2)[month].setValue(tempHelsinki[year][month]);
    }
    // Add the row to the set
    dataSet->append(dataRow);
    dataSet2->append(dataRow2);
}

// Add data to the data proxy (the data proxy assumes ownership of it)
m_primarySeries->dataProxy()->resetArray(dataSet, m_years, m_months);
m_secondarySeries->dataProxy()->resetArray(dataSet2, m_years, m_months);
Now the series have data to show.
Using Widgets to Control the Graph
There isn't much interaction yet, so let's continue by adding some widgets back in the application main. Let's just focus on two as an example:
QSlider *rotationSliderX = new QSlider(Qt::Horizontal, widget);
rotationSliderX->setTickInterval(30);
rotationSliderX->setTickPosition(QSlider::TicksBelow);
rotationSliderX->setMinimum(-180);
rotationSliderX->setValue(0);
rotationSliderX->setMaximum(180);
QSlider *rotationSliderY = new QSlider(Qt::Horizontal, widget);
rotationSliderY->setTickInterval(15);
rotationSliderY->setTickPosition(QSlider::TicksAbove);
rotationSliderY->setMinimum(-90);
rotationSliderY->setValue(0);
rotationSliderY->setMaximum(90);
We can use these slider widgets to rotate the graph instead of just using the mouse or touch.
Let's add them to the vertical layout we created earlier:
vLayout->addWidget(new QLabel(QStringLiteral("Rotate horizontally")));
vLayout->addWidget(rotationSliderX, 0, Qt::AlignTop);
vLayout->addWidget(new QLabel(QStringLiteral("Rotate vertically")));
vLayout->addWidget(rotationSliderY, 0, Qt::AlignTop);
Then we'll connect them to methods in GraphModifier:
QObject::connect(rotationSliderX, &QSlider::valueChanged, modifier, &GraphModifier::rotateX);
QObject::connect(rotationSliderY, &QSlider::valueChanged, modifier, &GraphModifier::rotateY);
Here are the methods in GraphModifier the signals were connected to. The camera is controlled via the scene object. This time we specify the actual camera position along the orbit around the center point, instead of specifying a preset camera angle:
void GraphModifier::rotateX(int rotation)
{
    m_xRotation = rotation;
    m_graph->scene()->activeCamera()->setCameraPosition(m_xRotation, m_yRotation);
}

void GraphModifier::rotateY(int rotation)
{
    m_yRotation = rotation;
    m_graph->scene()->activeCamera()->setCameraPosition(m_xRotation, m_yRotation);
}
Now these two sliders can be used to rotate the graph.
And so we have an application in which we can control:
- Graph rotation
- Label style
- Camera preset
- Background visibility
- Grid visibility
- Bar shading smoothness
- Visibility of the second bar series
- Value axis direction
- Axis title visibility and rotation
- Data range to be shown
- Bar style
- Selection mode
- Theme
- Shadow quality
- Font
- Font size
- Axis label rotation
Selecting a Row/column by Clicking an Axis Label
Selection by axis label is default functionality for bar graphs. As an example, you can select rows by clicking an axis label in the following way:
- Change selection mode to
SelectionRow - Click a year label
- The row with the clicked year is selected
You can use the same method with SelectionSlice and SelectionItem flags, as long as you have either SelectionRow or SelectionColumn set as well.
Zooming to Selection
As an example of adjusting camera target we have implemented an animation of zooming to selection via a button press. Animation initializations are done in the constructor:
Q3DCamera *camera = m_graph->scene()->activeCamera();
m_defaultAngleX = camera->xRotation();
m_defaultAngleY = camera->yRotation();
m_defaultZoom = camera->zoomLevel();
m_defaultTarget = camera->target();

m_animationCameraX.setTargetObject(camera);
m_animationCameraY.setTargetObject(camera);
m_animationCameraZoom.setTargetObject(camera);
m_animationCameraTarget.setTargetObject(camera);

m_animationCameraX.setPropertyName("xRotation");
m_animationCameraY.setPropertyName("yRotation");
m_animationCameraZoom.setPropertyName("zoomLevel");
m_animationCameraTarget.setPropertyName("target");

int duration = 1700;
m_animationCameraX.setDuration(duration);
m_animationCameraY.setDuration(duration);
m_animationCameraZoom.setDuration(duration);
m_animationCameraTarget.setDuration(duration);

// The zoom always first zooms out above the graph and then zooms in
qreal zoomOutFraction = 0.3;
m_animationCameraX.setKeyValueAt(zoomOutFraction, QVariant::fromValue(0.0f));
m_animationCameraY.setKeyValueAt(zoomOutFraction, QVariant::fromValue(90.0f));
m_animationCameraZoom.setKeyValueAt(zoomOutFraction, QVariant::fromValue(50.0f));
m_animationCameraTarget.setKeyValueAt(zoomOutFraction,
                                      QVariant::fromValue(QVector3D(0.0f, 0.0f, 0.0f)));
The function GraphModifier::zoomToSelectedBar() contains the rest of the functionality:
void GraphModifier::zoomToSelectedBar()
{
    m_animationCameraX.stop();
    m_animationCameraY.stop();
    m_animationCameraZoom.stop();
    m_animationCameraTarget.stop();

    Q3DCamera *camera = m_graph->scene()->activeCamera();
    float currentX = camera->xRotation();
    float currentY = camera->yRotation();
    float currentZoom = camera->zoomLevel();
    QVector3D currentTarget = camera->target();

    m_animationCameraX.setStartValue(QVariant::fromValue(currentX));
    m_animationCameraY.setStartValue(QVariant::fromValue(currentY));
    m_animationCameraZoom.setStartValue(QVariant::fromValue(currentZoom));
    m_animationCameraTarget.setStartValue(QVariant::fromValue(currentTarget));

    QPoint selectedBar = m_graph->selectedSeries()
            ? m_graph->selectedSeries()->selectedBar()
            : QBar3DSeries::invalidSelectionPosition();

    if (selectedBar != QBar3DSeries::invalidSelectionPosition()) {
        // Normalize selected bar position within axis range to determine target coordinates
        QVector3D endTarget;
        float xMin = m_graph->columnAxis()->min();
        float xRange = m_graph->columnAxis()->max() - xMin;
        float zMin = m_graph->rowAxis()->min();
        float zRange = m_graph->rowAxis()->max() - zMin;
        endTarget.setX((selectedBar.y() - xMin) / xRange * 2.0f - 1.0f);
        endTarget.setZ((selectedBar.x() - zMin) / zRange * 2.0f - 1.0f);

        // Rotate the camera so that it always points approximately to the graph center
        qreal endAngleX = 90.0 - qRadiansToDegrees(qAtan(qreal(endTarget.z() / endTarget.x())));
        if (endTarget.x() > 0.0f)
            endAngleX -= 180.0f;
        float barValue = m_graph->selectedSeries()->dataProxy()->itemAt(selectedBar.x(),
                                                                        selectedBar.y())->value();
        float endAngleY = barValue >= 0.0f ? 30.0f : -30.0f;
        if (m_graph->valueAxis()->reversed())
            endAngleY *= -1.0f;

        m_animationCameraX.setEndValue(QVariant::fromValue(float(endAngleX)));
        m_animationCameraY.setEndValue(QVariant::fromValue(endAngleY));
        m_animationCameraZoom.setEndValue(QVariant::fromValue(250));
        m_animationCameraTarget.setEndValue(QVariant::fromValue(endTarget));
    } else {
        // No selected bar, so return to the default view
        m_animationCameraX.setEndValue(QVariant::fromValue(m_defaultAngleX));
        m_animationCameraY.setEndValue(QVariant::fromValue(m_defaultAngleY));
        m_animationCameraZoom.setEndValue(QVariant::fromValue(m_defaultZoom));
        m_animationCameraTarget.setEndValue(QVariant::fromValue(m_defaultTarget));
    }

    m_animationCameraX.start();
    m_animationCameraY.start();
    m_animationCameraZoom.start();
    m_animationCameraTarget.start();
}
The QPropertyAnimation m_animationCameraTarget targets Q3DCamera::target property, which takes a value normalized to the range (-1, 1). We figure out where the selected bar is relative to axes, and use that as the end value for m_animationCameraTarget:
QVector3D endTarget;
float xMin = m_graph->columnAxis()->min();
float xRange = m_graph->columnAxis()->max() - xMin;
float zMin = m_graph->rowAxis()->min();
float zRange = m_graph->rowAxis()->max() - zMin;
endTarget.setX((selectedBar.y() - xMin) / xRange * 2.0f - 1.0f);
endTarget.setZ((selectedBar.x() - zMin) / zRange * 2.0f - 1.0f);
    ...
m_animationCameraTarget.setEndValue(QVariant::fromValue(endTarget));
Likewise, we want to angle the camera so that it always points approximately to the center of the graph at the end of the animation:
qreal endAngleX = 90.0 - qRadiansToDegrees(qAtan(qreal(endTarget.z() / endTarget.x())));
if (endTarget.x() > 0.0f)
    endAngleX -= 180.0f;
float barValue = m_graph->selectedSeries()->dataProxy()->itemAt(selectedBar.x(),
                                                                selectedBar.y())->value();
float endAngleY = barValue >= 0.0f ? 30.0f : -30.0f;
if (m_graph->valueAxis()->reversed())
    endAngleY *= -1.0f;
Example Contents
Files:
© 2018 The Qt Company Ltd. Documentation contributions included herein are the copyrights of their respective owners. The documentation provided herein is licensed under the terms of the GNU Free Documentation License version 1.3 as published by the Free Software Foundation. Qt and respective logos are trademarks of The Qt Company Ltd. in Finland and/or other countries worldwide. All other trademarks are property of their respective owners.