Warning
This section contains snippets that were automatically translated from C++ to Python and may contain errors.
Changing the Color and State of Bars#
Shows how to use a selection feature for the bar chart.
Note
This is part of the Charts with Widgets Gallery example.
The example shows how to change the color and state of bars using setBarSelected().
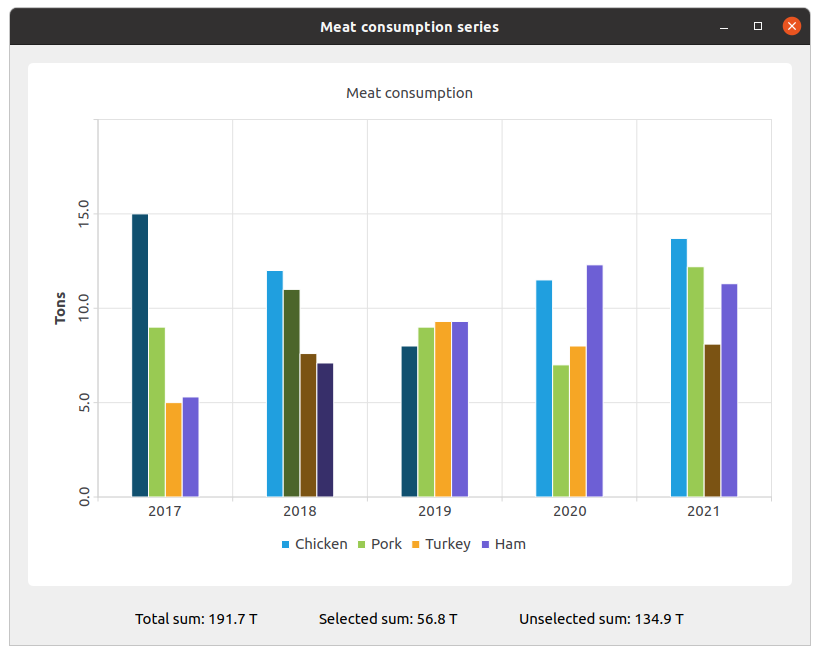
We create the sets and fill them with the data. Then we create a series and append data to it.
setChicken = createChickenSet()
setPork = createPorkSet()
setTurkey = createTurkeySet()
setHam = createHamSet()
totalSum = setChicken.sum() + setPork.sum() + setTurkey.sum() + setHam.sum()
QList<QBarSet *> setList = QList<QBarSet *>{setChicken, setPork, setTurkey, setHam}
series = QBarSeries()
series.append(setList)
We create the chart and add series to it. Also, we add a title to the chart, set animation for the chart, and align the legend.
chart = QChart()
chart.addSeries(series)
chart.setTitle(tr("Meat Consumption (Click on bars to select them)"))
chart.setAnimationOptions(QChart.SeriesAnimations)
chart.legend().setVisible(True)
chart.legend().setAlignment(Qt.AlignBottom)
chart.layout().setContentsMargins(0, 0, 0, 0)
Here we set the color for the selected bars.
barSets = series.barSets()
for barSet in barSets:
    barSet.setSelectedColor(barSet.brush().color().darker())
Next step is adding axes: QBarCategoryAxis for years of measurements and QValueAxis for values range.
categories = createYearCategories()
axisX = QBarCategoryAxis()
axisX.setCategories(categories)
chart.addAxis(axisX, Qt.AlignBottom)
series.attachAxis(axisX)
axisY = QValueAxis()
axisY.setRange(0, 20)
axisY.setTitleText(tr("Tons"))
axisY.setLabelsAngle(-90)
axisY.setTitleVisible(True)
chart.addAxis(axisY, Qt.AlignLeft)
series.attachAxis(axisY)
Then we add the chart view to put the chart in.
chartView = QChartView(chart, self)
chartView.setRenderHint(QPainter.Antialiasing)
Here we create a widget for labels of values of selected and unselected bars.
labelWidget = QWidget(self)
labelLayout = QHBoxLayout(labelWidget)
labelLayout.setAlignment(Qt.AlignCenter)
totalSumLabel = QLabel(tr("Total sum: %1 T").arg(totalSum), self)
labelLayout.addWidget(totalSumLabel)
totalSumLabel.setContentsMargins(0, 0, 54, 0)
selectedSumLabel = QLabel(tr("Selected sum: 0 T"), self)
labelLayout.addWidget(selectedSumLabel)
unselectedSumLabel = QLabel(tr("Unselected sum: %1 T").arg(totalSum), self)
labelLayout.addWidget(unselectedSumLabel)
unselectedSumLabel.setContentsMargins(54, 0, 0, 0)
We connect selecting of a specific bar with labels of values using a lambda. set->toggleSelection({index}) sets the bar selected.
series.clicked.connect(series, [=](int index, QBarSet *set) {
    set.toggleSelection({index})
    selectedSum = 0.
    for i in range(0, setList.size()):
        selectedIndices = setList.at(i).selectedBars()
        for k in range(0, selectedIndices.size()):
            selectedSum += setList.at(i).at(selectedIndices.at(k))

    selectedSumLabel.setText(tr("Selected sum: %1 T").arg(selectedSum))
    # Because of rounding errors, selectedSum can result in being bigger than total sum
    unselectedSum = totalSum - selectedSum < 0 if 0. else totalSum - selectedSum
    unselectedSumLabel.setText(
        tr("Unselected sum: %1 T")
            .arg(unselectedSum)
        )
})
Finally, we create the main layout.
mainLayout = QVBoxLayout(self)
mainLayout.addWidget(chartView)
mainLayout.addWidget(labelWidget)