ScatterChart Example
The example shows how to create a simple scatter chart.
Running the Example
To run the example from Qt Creator, open the Welcome mode and select the example from Examples. For more information, visit Building and Running an Example.
Creating Scatter Charts
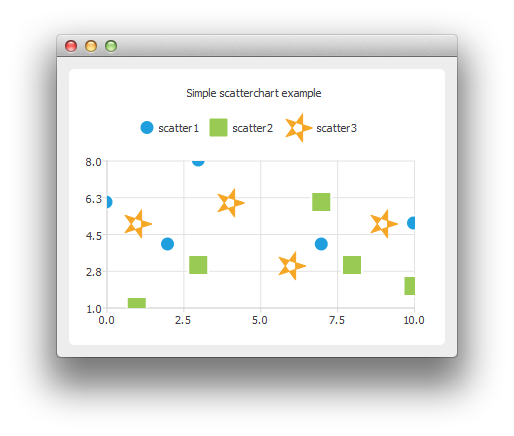
To create scatter charts, a QScatterSeries instance is needed. Here we create a scatter series instance, and set the type and width of outline for the scatter points.
QScatterSeries *series0 = new QScatterSeries();
series0->setName("scatter1");
series0->setMarkerShape(QScatterSeries::MarkerShapeCircle);
series0->setMarkerSize(15.0);

QScatterSeries *series1 = new QScatterSeries();
series1->setName("scatter2");
series1->setMarkerShape(QScatterSeries::MarkerShapeRectangle);
series1->setMarkerSize(20.0);

QScatterSeries *series2 = new QScatterSeries();
series2->setName("scatter3");
series2->setMarkerShape(QScatterSeries::MarkerShapeRectangle);
series2->setMarkerSize(30.0);
We add the data to be shown. We can use the append() member function or use the stream operator.
series0->append(0, 6);
series0->append(2, 4);
series0->append(3, 8);
series0->append(7, 4);
series0->append(10, 5);

*series1 << QPointF(1, 1) << QPointF(3, 3) << QPointF(7, 6) << QPointF(8, 3) << QPointF(10, 2);
*series2 << QPointF(1, 5) << QPointF(4, 6) << QPointF(6, 3) << QPointF(9, 5);
We can define the brush of the scatter series to be an image. Here the image is a star created using QPainterPath.
QPainterPath starPath;
starPath.moveTo(28, 15);
for (int i = 1; i < 5; ++i) {
    starPath.lineTo(14 + 14 * qCos(0.8 * i * M_PI),
                    15 + 14 * qSin(0.8 * i * M_PI));
}
starPath.closeSubpath();

QImage star(30, 30, QImage::Format_ARGB32);
star.fill(Qt::transparent);

QPainter painter(&star);
painter.setRenderHint(QPainter::Antialiasing);
painter.setPen(QRgb(0xf6a625));
painter.setBrush(painter.pen().color());
painter.drawPath(starPath);

series2->setBrush(star);
series2->setPen(QColor(Qt::transparent));
In the end we enable anti-aliasing, set the chart title, and add the scatter series onto the chart. We also disable drop shadow, because it would not look good on an application with only chart view shown.
setRenderHint(QPainter::Antialiasing);
chart()->addSeries(series0);
chart()->addSeries(series1);
chart()->addSeries(series2);

chart()->setTitle("Simple scatterchart example");
chart()->createDefaultAxes();
chart()->setDropShadowEnabled(false);
We can also use the scatter points as legend markers.
chart()->legend()->setMarkerShape(QLegend::MarkerShapeFromSeries);
The chart is ready to be shown.
    ChartView *chartView = new ChartView();
    QMainWindow window;
    window.setCentralWidget(chartView);
    window.resize(400, 300);
    window.show();
© 2025 The Qt Company Ltd. Documentation contributions included herein are the copyrights of their respective owners. The documentation provided herein is licensed under the terms of the GNU Free Documentation License version 1.3 as published by the Free Software Foundation. Qt and respective logos are trademarks of The Qt Company Ltd. in Finland and/or other countries worldwide. All other trademarks are property of their respective owners.
