
ChartView QML Type
Chart element. More...
| Import Statement: | import QtCharts 2.1 |
Properties
- animationDuration : int
- animationEasingCurve : easing
- animationOptions : Animation
- axes : list<AbstractAxis>
- backgroundColor : color
- backgroundRoundness : real
- count : int
- dropShadowEnabled : bool
- legend : Legend
- locale : locale
- localizeNumbers : bool
- margins : Margins
- plotArea : rect
- plotAreaColor : color
- theme : Theme
- title : string
- titleColor : color
- titleFont : Font
Signals
- seriesAdded(AbstractSeries series)
- seriesRemoved(AbstractSeries series)
Methods
- Axis axisX(AbstractSeries series)
- Axis axisY(AbstractSeries series)
- AbstractSeries createSeries(SeriesType type, string name, AbstractAxis axisX, AbstractAxis axisY)
- isZoomed()
- point mapToPosition(point value, AbstractSeries series)
- point mapToValue(point position, AbstractSeries series)
- removeAllSeries()
- removeSeries(AbstractSeries series)
- scrollDown(real pixels)
- scrollLeft(real pixels)
- scrollRight(real pixels)
- scrollUp(real pixels)
- AbstractSeries series(string name)
- AbstractSeries series(int index)
- setAxisX(AbstractAxis axis, AbstractSeries series)
- setAxisY(AbstractAxis axis, AbstractSeries series)
- zoom(real factor)
- zoomIn(rect rectangle)
- zoomIn()
- zoomOut()
- zoomReset()
Detailed Description
ChartView element is the parent that is responsible for showing different chart series types.
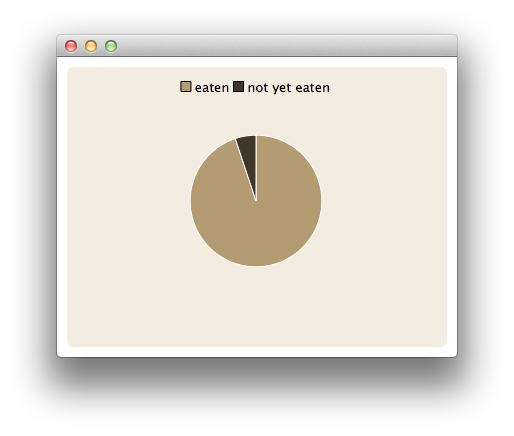
The following QML shows how to create a simple chart with one pie series:
import QtQuick 2.0
import QtCharts 2.0

ChartView {
    width: 400
    height: 300
    theme: ChartView.ChartThemeBrownSand
    antialiasing: true

    PieSeries {
        id: pieSeries
        PieSlice { label: "eaten"; value: 94.9 }
        PieSlice { label: "not yet eaten"; value: 5.1 }
    }
}
Property Documentation
animationOptions : Animation |
axes : list<AbstractAxis> |
The axes of the ChartView.
The color of the chart's background. By default background color is defined by chart theme.
See also ChartView::theme.
The diameter of the rounding circle at the corners of the chart background.
legend : Legend |
The legend of the chart. Legend lists all the series, pie slices and bar sets added on the chart.
Sets the locale used to format various chart labels when localizeNumbers is true. This also determines the locale used to format DateTimeAxis labels regardless of localizeNumbers property. Defaults to application default locale at the time the chart is constructed.
This QML property was introduced in QtCharts 2.0.
See also localizeNumbers.
When true, all generated numbers appearing in various series and axis labels will be localized using the default QLocale of the application, which defaults to the system locale. When false, the "C" locale is always used. Defaults to false.
This QML property was introduced in QtCharts 2.0.
See also locale.
margins : Margins |
The area on the ChartView that is used for drawing series. This is the ChartView rect without the margins.
See also ChartView::margins.
The color of the background of the chart's plot area. By default plot area background uses chart's background color.
See also ChartView::backgroundColor.
Theme defines the visual appearance of the chart, including for example colors, fonts, line widths and chart background.
The title of the chart, shown on top of the chart.
See also ChartView::titleColor.
Signal Documentation
seriesAdded(AbstractSeries series) |
The series has been added to the chart.
seriesRemoved(AbstractSeries series) |
The series has been removed from the chart. Please note that series is no longer a valid object after the signal handler has completed.
Method Documentation
Axis axisX(AbstractSeries series) |
The x-axis of the series.
Axis axisY(AbstractSeries series) |
The y-axis of the series.
AbstractSeries createSeries(SeriesType type, string name, AbstractAxis axisX, AbstractAxis axisY) |
Creates a series object of type to the chart with name name, optional axis axisX and optional axis axisY. For example:
// lineSeries is a LineSeries object that has already been added to the ChartView; re-use it's axes
var myAxisX = chartView.axisX(lineSeries);
var myAxisY = chartView.axisY(lineSeries);
var scatter = chartView.createSeries(ChartView.SeriesTypeScatter, "scatter series", myAxisX, myAxisY);
point mapToPosition(point value, AbstractSeries series) |
Returns the position on the chart that corresponds to the value in the series domain.
point mapToValue(point position, AbstractSeries series) |
Returns the value in the series domain that corresponds to the position relative to the chart.
removeSeries(AbstractSeries series) |
Removes the series from the chart. The series object is also destroyed.
Scrolls down by pixels. This is a convenience function that suits for example for key navigation.
Scrolls to left by pixels. This is a convenience function that suits for example for key navigation.
Scrolls to right by pixels. This is a convenience function that suits for example for key navigation.
Scrolls up by pixels. This is a convenience function that suits for example for key navigation.
AbstractSeries series(string name) |
Returns the first series on the chart with name. If there is no series with that name, returns null.
AbstractSeries series(int index) |
Returns the series with index on the chart. This allows you to loop through the series of a chart together with the count property of the chart.
setAxisX(AbstractAxis axis, AbstractSeries series) |
Set the x-axis of the series.
setAxisY(AbstractAxis axis, AbstractSeries series) |
Set the y-axis of the series.
Zooms in by factor on the center of the chart.
A factor over 1.0 zooms the view in and factor between 0.0 and 1.0 zooms out.
Zooms in the view to a maximum level at which rectangle is still fully visible.
Note: This is not supported for polar charts.
Resets the series domains to what they were before any zoom method was called. Note that this will also reset any scrolls and explicit axis range settings done between the first zoom operation and calling this method. If no zoom operation has been done, this method does nothing.
© 2016 The Qt Company Ltd. Documentation contributions included herein are the copyrights of their respective owners. The documentation provided herein is licensed under the terms of the GNU Free Documentation License version 1.3 as published by the Free Software Foundation. Qt and respective logos are trademarks of The Qt Company Ltd. in Finland and/or other countries worldwide. All other trademarks are property of their respective owners.