
C
Using the In-Scene Debug and Profile views
The Qt 3D Studio Runtime includes a set of built-in views that can be brought up on top of the scene at any time. These panes are rendered completely inside the 3D scene and are therefore available on any platform, even when running on mobile or embedded systems without a windowing system (for example, via the eglfs platform plugin), with the Qt 3D Studio presentation and the Qt Quick user interface occupying the entire scren.
Activation
In the Viewer application, toggle with F10 or the Profile and Debug submenu under View.
In applications these views have no built-in shortcuts. It is up to the application to toggle visibility. From C++ this is done via Q3DSPresentation::profileUiVisible or Q3DSViewerSettings::showRenderStats. From QML the corresponding properties are Presentation::profileUiVisible and ViewerSettings::showRenderStats.
In order to enable all features in the debug and profile views, presentations must be loaded with profiling enabled. In this mode the Qt 3D objects managed by the runtime get tracked, and various statistics get collected internally. This is enabled by default in the Viewer application, whereas applications have to opt-in explicitly via Q3DSPresentation::profilingEnabled or Presentation::profilingEnabled.
As an example, the following is how the Qt 3D Studio Runtime: Simple QML Example enables and connects the toggling of these views to a Qt Quick Controls button:
    Studio3D {
        Presentation {
            id: presentation
            source: "qrc:/presentation/barrel.uip"
            profilingEnabled: true
        }
    }

    Button {
        text: "Toggle profile UI"
        onClicked: presentation.profileUiVisible = !s3dpres.profileUiVisible
        ...
    }
}
Features
- CPU and memory usage of the application process (available on Windows, Linux, and Android)
- OpenGL context information
- Frame rate, with a visualization of its history during the last 100 frames (configurable)
- Various timings from the loading of the scene
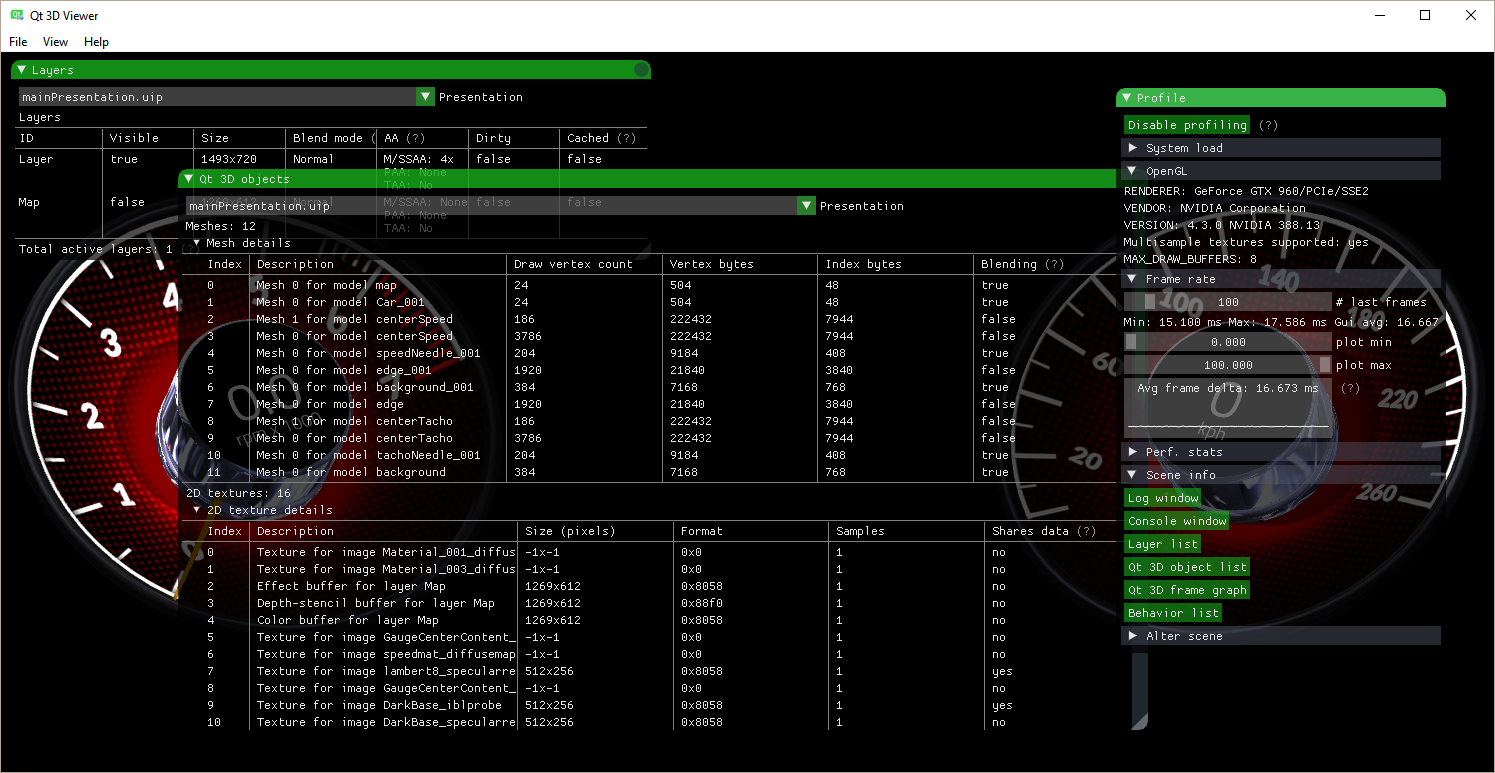
- Qt 3D object list - showing the active list of mesh and texture objects can give an approximate understanding of the graphics resource usage and can also uncover sub-optimal asset situations that lead to degraded performance. For example, having a large number of meshes in the list for a seemingly simple scene should warrant an investigation of the assets as they may be overly complex. Similarly, large textures are often not ideal, yet they may be overlooked during the design phase of the presentation. Here it becomes immediately obvious if some texture map is unncessarily large.
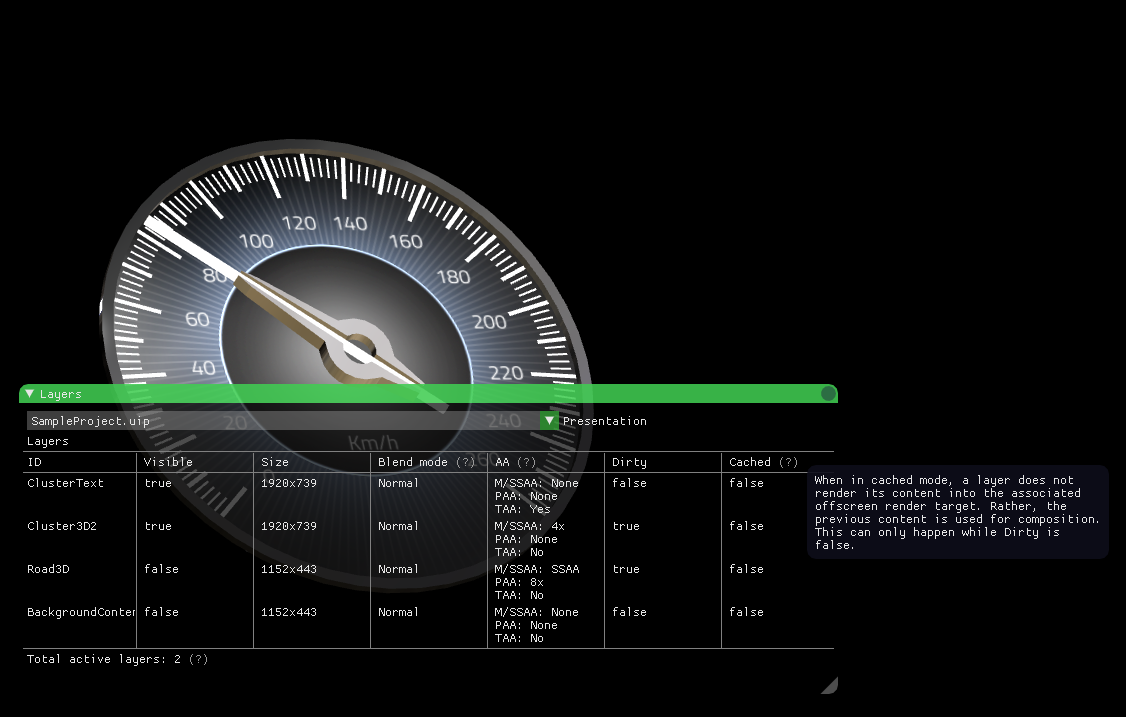
- Layer list - showing the list of active and inactive
layersin the presentation. A Qt 3D Studio presentations consists of one or more layers which are backed by OpenGL textures each. These are composed together with the appropriate blending mode (and optionally with post-postprocessing effects applied) to get the final output. It is important to understand that each layer corresponds to a separate render target (e.g. an OpenGL texture and the corresponding framebuffer setup) in the engine and is using graphics resources like any other texture map. The performance of the composition is also important, especially on mobile and embedded where the fragment processing power can be more limited. - A filterable log view (with the debug messages that are also printed on the default qDebug output of the platform)
- A number of other, experimental views
The views and their contents are live at any time, meaning they always reflect the Qt 3D Studio Runtime's state for the current frame.
Watch out for the tooltips marked with (?). Moving the mouse cursor over these results in showing additional information about the item in question which can be useful in understanding the implications of certain statistics.
Note: the feature set may get extended or changed in future versions. It is also possible that certain information gets folded into the Qt 3D Studio application itself in the future.
Available under certain Qt licenses.
Find out more.