Profile CMake code
With the profiling support in CMake 3.18, and later, you can find out where CMake is spending time configuring your project.
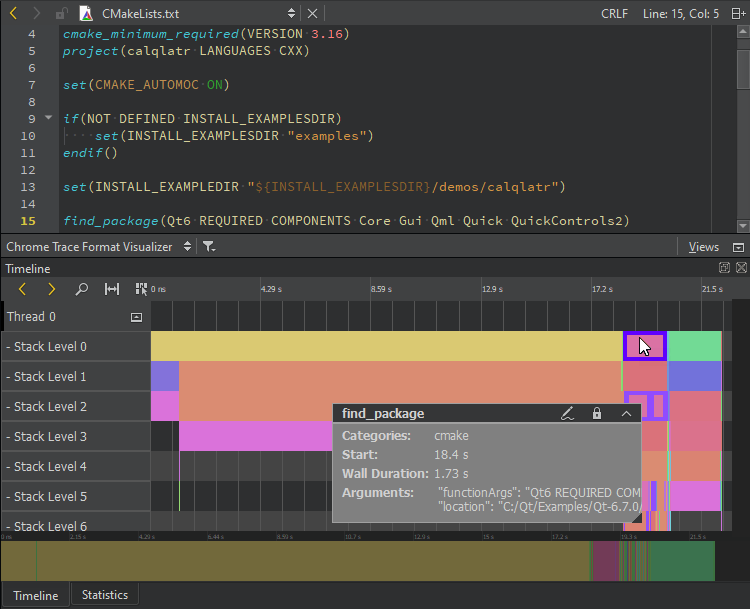
To view profiling information in the Chrome Trace Format Visualizer, select Analyze > CMake Profiler.
See also CMake and Visualizing Chrome Trace Events.
© 2024 The Qt Company Ltd. Documentation contributions included herein are the copyrights of their respective owners. The documentation provided herein is licensed under the terms of the GNU Free Documentation License version 1.3 as published by the Free Software Foundation. Qt and respective logos are trademarks of The Qt Company Ltd in Finland and/or other countries worldwide. All other trademarks are property of their respective owners.