Specify Valgrind settings for a project
Specify settings for running applications on the Run device that you select for a kit in Projects > Build & Run > Run > Run Settings.
Qt Creator integrates Valgrind code analysis tools for detecting memory leaks and profiling function execution.
To specify Valgrind settings for the current project:
- In the Valgrind Settings section, select Custom.
- Specify Valgrind settings for the project.
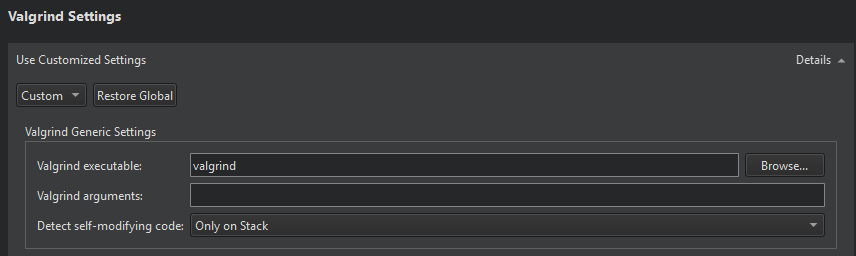
- In Valgrind executable, specify the path to the Valgrind executable.
- In Valgrind arguments, specify additional arguments for Valgrind.
- In Detect self-modifying code, select whether to detect self-modifying code and where to detect it: only on stack, everywhere, or everywhere except in file-backend mappings.
Click Restore Global to revert to the global settings.
To specify global Valgrind settings, select Preferences > Analyzer.
See also Configuring Projects, Selecting Options for Memory Analysis, Selecting Profiling Options, and Using Valgrind Code Analysis Tools.
© 2024 The Qt Company Ltd. Documentation contributions included herein are the copyrights of their respective owners. The documentation provided herein is licensed under the terms of the GNU Free Documentation License version 1.3 as published by the Free Software Foundation. Qt and respective logos are trademarks of The Qt Company Ltd in Finland and/or other countries worldwide. All other trademarks are property of their respective owners.