StocQt
A configurable stock chart for 100 stocks.
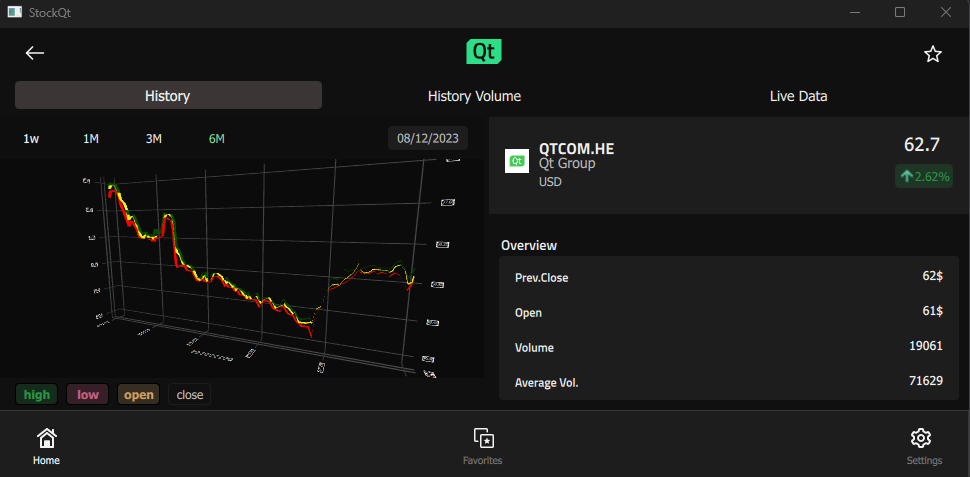
The StocQt application presents trend charts for a custom list of 100 stocks based on the NASDAQ-100. It allows the user to choose stocks from a list. The application also allows for favoriting up to 5 stocks for use in comparison charts.
The application uses several custom types such as Search, StockCheckBox, StockChart, StockView, and SettingsView. These types present the stock data in a readable form and let the user customize the trend chart. For example, the user can choose to view the weekly, monthly, quarterly, or half-yearly trends in the stock price.
The application uses a custom StockEngine singleton implemented in C++ for data handling, such as API requests and favoriting stocks. It implements a custom APIHandler class for fetching the online data.
void ApiHandler::stockHistory(const QString &symbol,
                              std::function<void(QList<HistoryData>)> onComplete)
The application uses the ObjectModel type to access visual data models that it depends on.
    id: mainWindow
        ...
    ListView {
        id: root
        ...
        model: ObjectModel {
            Item {
                id: stockContainer
                width: root.width
                height: root.height
                StockView {
                    id: stockView
                    anchors.fill: parent
                    visible: false
                    width: root.width
                    height: root.height
                    stateGroup: stateList
                }

                StockListView {
                    id: listView
                    visible: true
                    anchors.fill: parent
                    width: root.width
                    height: root.height
                    stateGroup: stateList
                }
            }

            FavoriteView {
                id: favoriteView
                width: root.width
                height: root.height
            }

            SettingsView {
                id: infoView
                width: root.width
                height: root.height
            }
        }
    }
The StockListModel is a custom data model listing the stocks with basic information such as stock ID, name, value, and favorite. This application uses this data model when the user wants to choose another stock from the list.
StockView and FavoriteView are complex data models that present a trend chart for the selected stock or a group of up to 5 stocks. They use another custom type, StockChart or FavoriteChart, which loads the data from the StockEngine into ListModels and presents the graphical trend of the stock price using a Surface3D, Bars3D, or Scatter3D.
Rectangle {
    id: chart
        ...
    function updateHistory(){
        updateStartDate()
        let startPoint = StockEngine.stockModel.indexOf(startDate)
        let totalPoints = StockEngine.stockModel.historyCount()

        let width = startPoint / 50
        for (let i = 0; i < totalPoints; i++) {
            let epochInDays = StockEngine.stockModel.historyDate(i, false) / 86400
            appendSurfacePoint(openModel, width, epochInDays, StockEngine.stockModel.openPrice(i))
            appendSurfacePoint(closeModel,width, epochInDays, StockEngine.stockModel.closePrice(i))
            appendSurfacePoint(highModel,width, epochInDays, StockEngine.stockModel.highPrice(i))
            appendSurfacePoint(lowModel,width, epochInDays, StockEngine.stockModel.lowPrice(i))
        }
        ...
    Surface3D {
        id: historyGraph
        ...
            Surface3DSeries {
                id: highSeries
                visible: true
                baseColor: "green"
                shading: Surface3DSeries.Shading.Flat
                drawMode: Surface3DSeries.DrawSurface
                itemLabelFormat: "Time: @xLabel High:@yLabel$"
                ItemModelSurfaceDataProxy {
                    itemModel: highModel
                    rowRole: "row"
                    columnRole: "column"
                    yPosRole: "value"
                }
            },
The SettingsView presents information on the application.
To understand the application better, browse through its code using Qt Creator.
Running the Example
To run the example from Qt Creator, open the Welcome mode and select the example from Examples. For more information, see Qt Creator: Tutorial: Build and run.
See also QML Applications.
© 2026 The Qt Company Ltd. Documentation contributions included herein are the copyrights of their respective owners. The documentation provided herein is licensed under the terms of the GNU Free Documentation License version 1.3 as published by the Free Software Foundation. Qt and respective logos are trademarks of The Qt Company Ltd. in Finland and/or other countries worldwide. All other trademarks are property of their respective owners.
