
Qt Quick Demo - StocQt
A configurable stock chart for the NASDAQ-100.
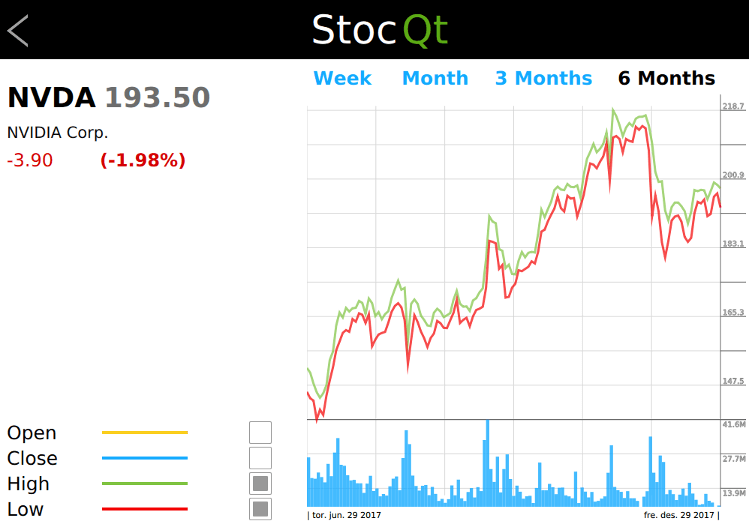
The StocQt application presents a trend chart for the first stock in the list of NASDAQ-100 stocks. It allows the user to choose another stock from the list, and fetches the required data from the offline dataset using XMLHttpRequest.
The application uses several custom types such as Button, CheckBox, StockChart, StockInfo, StockView, and so on. These types are used to present the stock data in a readable form and also let the user customize the trend chart. For example, the user can choose to view the weekly, monthly, quarterly, or half yearly trends in the stock price.
The application uses the ObjectModel type to access the two visual data models that it depends on.
        ListView {
            id: root
        ...
            model: ObjectModel {
                StockListView {
                    id: listView
                    width: root.width
                    height: root.height
                }

                StockView {
                    id: stockView
                    width: root.width
                    height: root.height
                    stocklist: listView
                    stock: stock
                }
            }
        }
The StockListView model is a static data model listing the NASDAQ-100 stocks with basic information such as stockId, name, value, change, and so on. This data model is used by the application if the user wants to choose another stock from the list.
StockView is a complex data model that presents a trend chart for the selected stock. It uses another custom type, StockChart, which presents the graphical trend of the stock price using a Canvas. This data model is used for most of the time during the lifetime of the application.
Rectangle {
    id: chart
    ...
        Canvas {
            id: canvas
        ...
            onPaint: {
                numPoints = stockModel.indexOf(chart.startDate);
                if (chart.gridSize == 0)
                    chart.gridSize = numPoints

                var ctx = canvas.getContext("2d");
                ctx.globalCompositeOperation = "source-over";
                ctx.lineWidth = 1;

                drawBackground(ctx);

                if (!stockModel.ready) {
                    drawError(ctx, "No data available.");
                    return;
                }

                var highestPrice = 0;
                var highestVolume = 0;
                var lowestPrice = -1;
                var points = [];
                for (var i = numPoints, j = 0; i >= 0 ; i -= pixelSkip, j += pixelSkip) {
                    var price = stockModel.get(i);
                    if (parseFloat(highestPrice) < parseFloat(price.high))
                        highestPrice = price.high;
                    if (parseInt(highestVolume, 10) < parseInt(price.volume, 10))
                        highestVolume = price.volume;
                    if (lowestPrice < 0 || parseFloat(lowestPrice) > parseFloat(price.low))
                        lowestPrice = price.low;
                    points.push({
                                    x: j * xGridStep,
                                    open: price.open,
                                    close: price.close,
                                    high: price.high,
                                    low: price.low,
                                    volume: price.volume
                                });
                }

                if (settings.drawHighPrice)
                    drawPrice(ctx, 0, numPoints, settings.highColor, "high", points, highestPrice, lowestPrice);
                if (settings.drawLowPrice)
                    drawPrice(ctx, 0, numPoints, settings.lowColor, "low", points, highestPrice, lowestPrice);
                if (settings.drawOpenPrice)
                    drawPrice(ctx, 0, numPoints,settings.openColor, "open", points, highestPrice, lowestPrice);
                if (settings.drawClosePrice)
                    drawPrice(ctx, 0, numPoints, settings.closeColor, "close", points, highestPrice, lowestPrice);

                drawVolume(ctx, 0, numPoints, settings.volumeColor, "volume", points, highestVolume);
                drawScales(ctx, highestPrice, lowestPrice, highestVolume);
            }
        }

        Text {
            id: fromDate
            color: "#000000"
            font.family: Settings.fontFamily
            font.pointSize: 8
            Layout.alignment: Qt.AlignLeft
            text: "| " + startDate.toDateString()
        }
        Text {
            id: toDate
            color: "#000000"
            font.family: Settings.fontFamily
            font.pointSize: 8
            Layout.alignment: Qt.AlignRight
            Layout.rightMargin: canvas.tickMargin
            Layout.columnSpan: 5
            text: endDate.toDateString() + " |"
        }
    }
}
To understand the application better, browse through its code using Qt Creator.
Running the Example
To run the example from Qt Creator, open the Welcome mode and select the example from Examples. For more information, visit Building and Running an Example.
Files:
- demos/stocqt/content/+windows/Settings.qml
- demos/stocqt/content/Banner.qml
- demos/stocqt/content/Button.qml
- demos/stocqt/content/CheckBox.qml
- demos/stocqt/content/Settings.qml
- demos/stocqt/content/StockChart.qml
- demos/stocqt/content/StockInfo.qml
- demos/stocqt/content/StockListDelegate.qml
- demos/stocqt/content/StockListModel.qml
- demos/stocqt/content/StockListView.qml
- demos/stocqt/content/StockModel.qml
- demos/stocqt/content/StockSettingsPanel.qml
- demos/stocqt/content/StockView.qml
- demos/stocqt/content/qmldir
- demos/stocqt/main.cpp
- demos/stocqt/stocqt.pro
- demos/stocqt/stocqt.qml
- demos/stocqt/stocqt.qmlproject
- demos/stocqt/stocqt.qrc
Images:
See also QML Applications.
© 2020 The Qt Company Ltd. Documentation contributions included herein are the copyrights of their respective owners. The documentation provided herein is licensed under the terms of the GNU Free Documentation License version 1.3 as published by the Free Software Foundation. Qt and respective logos are trademarks of The Qt Company Ltd. in Finland and/or other countries worldwide. All other trademarks are property of their respective owners.