
Audiolevels Example
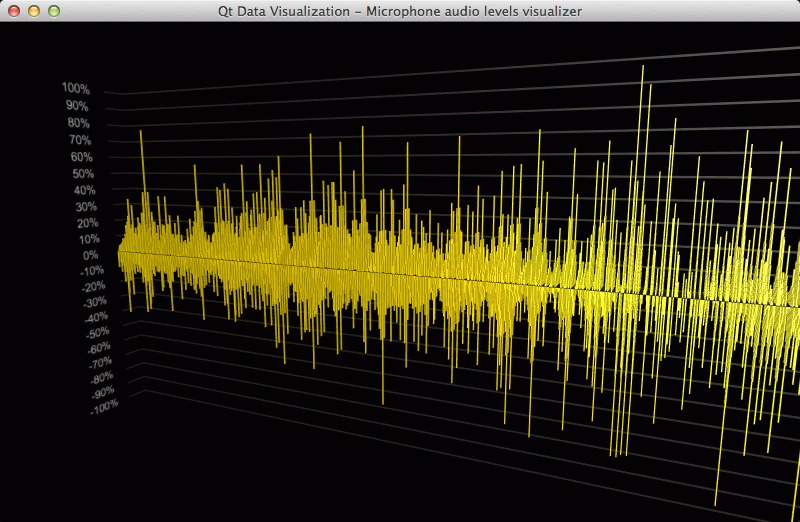
The audiolevels example shows how feed real-time dynamic data to a graph using Q3DBars.
This example reads the audio levels from a microphone and displays those levels in a bar graph. To increase the load for demonstration purposes, and to make the graph little fancier, slightly modified data is used to fill multiple rows.
The interesting stuff happens in AudioLevels and AudioLevelsIODevice classes, so we concentrate on those and skip explaining the basic Q3DBars functionality - for that see Bars Example.
Running the Example
To run the example from Qt Creator, open the Welcome mode and select the example from Examples. For more information, visit Building and Running an Example.
Visualizing Audio Levels
AudioLevelsIODevice subclasses QIODevice and is given as input device for QAudioInput class, so it receives microphone data.
In the header file for AudioLevels class we declare necessary members:
Q3DBars *m_graph;
AudioLevelsIODevice *m_device;
QAudioInput *m_audioInput;
And initialize the microphone listening in the source:
QAudioDeviceInfo inputDevice = QAudioDeviceInfo::defaultInputDevice();

if (inputDevice.supportedSampleRates().size() > 0
        && inputDevice.supportedChannelCounts().size() > 0
        && inputDevice.supportedSampleSizes().size() > 0
        && inputDevice.supportedCodecs().size() > 0) {
    QAudioFormat formatAudio;
    formatAudio.setSampleRate(inputDevice.supportedSampleRates().at(0));
    formatAudio.setChannelCount(inputDevice.supportedChannelCounts().at(0));
    formatAudio.setSampleSize(inputDevice.supportedSampleSizes().at(0));
    formatAudio.setCodec(inputDevice.supportedCodecs().at(0));
    formatAudio.setByteOrder(QAudioFormat::LittleEndian);
    formatAudio.setSampleType(QAudioFormat::UnSignedInt);

    m_audioInput = new QAudioInput(inputDevice, formatAudio, this);
#ifdef Q_OS_MAC
    // OS X seems to wait for entire buffer to fill before calling writeData, so use smaller buffer
    m_audioInput->setBufferSize(256);
#else
    m_audioInput->setBufferSize(1024);
#endif

    m_device = new AudioLevelsIODevice(m_graph->seriesList().at(0)->dataProxy(), this);
    m_device->open(QIODevice::WriteOnly);

    m_audioInput->start(m_device);
} else {
    // No graph content can be shown, so add a custom warning label
    QCustom3DLabel *titleLabel = new QCustom3DLabel("No valid audio input device found",
                                                    QFont(),
                                                    QVector3D(0.2f, 0.2f, 0.0f),
                                                    QVector3D(1.0f, 1.0f, 0.0f),
                                                    QQuaternion());
    titleLabel->setPositionAbsolute(true);
    titleLabel->setFacingCamera(true);
    m_graph->addCustomItem(titleLabel);
}
In the header file for AudioLevelsIODevice class we store pointers to the data proxy and also the data array we give to the proxy, because we reuse the same array to keep memory reallocations to the minimum:
QBarDataProxy *m_proxy;
QBarDataArray *m_array;
In the source file we define some static constants to define size of the data array and the middle row index, as well as the resolution of the visualization. You may need to adjust these values to get decent performance in low-end devices:
static const int resolution = 8;
static const int rowSize = 800;
static const int rowCount = 7; // Must be odd number
static const int middleRow = rowCount / 2;
The resolution constant indicates the sample rate, for example, value 8 means every eighth byte from audio input is visualized. This is necessary to make the data readable, as it would otherwise make the graph scroll too fast.
In the AudioLevelsIODevice class constructor we initialize the data array:
m_array->reserve(rowCount);
for (int i = 0; i < rowCount; i++)
    m_array->append(new QBarDataRow(rowSize));
The AudioLevelsIODevice::writeData function is called whenever there is new audio data available to be visualized. There we move the old data along the rows and insert new data in the beginning of the rows:
qint64 AudioLevelsIODevice::writeData(const char *data, qint64 maxSize)
{
    // The amount of new data available.
    int newDataSize = maxSize / resolution;

    // If we get more data than array size, we need to adjust the start index for new data.
    int newDataStartIndex = qMax(0, (newDataSize - rowSize));

    // Move the old data ahead in the rows (only do first half of rows + middle one now).
    // If the amount of new data was larger than row size, skip copying.
    if (!newDataStartIndex) {
        for (int i = 0; i <= middleRow; i++) {
            QBarDataItem *srcPos = m_array->at(i)->data();
            QBarDataItem *dstPos = srcPos + newDataSize;
            memmove((void *)dstPos, (void *)srcPos, (rowSize - newDataSize) * sizeof(QBarDataItem));
        }
    }

    // Insert data in reverse order, so that newest data is always at the front of the row.
    int index = 0;
    for (int i = newDataSize - 1; i >= newDataStartIndex; i--) {
        // Add 0.01 to the value to avoid gaps in the graph (i.e. zero height bars).
        // Also, scale to 0...100
        float value = float(quint8(data[resolution * i]) - 128) / 1.28f + 0.01f;
        (*m_array->at(middleRow))[index].setValue(value);
        // Insert a fractional value into front half of the rows.
        for (int j = 1; j <= middleRow; j++) {
            float fractionalValue = value / float(j + 1);
            (*m_array->at(middleRow - j))[index].setValue(fractionalValue);
        }
        index++;
    }

    // Copy the front half of rows to the back half for symmetry.
    index = 0;
    for (int i = rowCount - 1; i > middleRow; i--) {
        QBarDataItem *srcPos = m_array->at(index++)->data();
        QBarDataItem *dstPos = m_array->at(i)->data();
        memcpy((void *)dstPos, (void *)srcPos, rowSize * sizeof(QBarDataItem));
    }

    // Reset the proxy array now that data has been updated to trigger a redraw.
    m_proxy->resetArray(m_array);

    return maxSize;
}
We use a couple of techniques here to improve performance. First, we reuse the existing data array, as this allows us to avoid any extra memory allocations in our application code. This also means the data array dimensions do not change, which further improves efficiency in the bar graph renderer. Secondly, since each row is a QVector of bar data items, which do not allocate any data that needs deletion, we can utilize memmove and memcpy functions to quickly move and copy data around.
Note: In the future versions of Qt Data Visualization, QBarDataItem might get extended so that it does allocate some memory to store other optional bar properties besides the value. In use cases where those optional properties are used, using memmove and memcpy could lead to memory leaks, so use them with care.
Files:
© 2019 The Qt Company Ltd. Documentation contributions included herein are the copyrights of their respective owners. The documentation provided herein is licensed under the terms of the GNU Free Documentation License version 1.3 as published by the Free Software Foundation. Qt and respective logos are trademarks of The Qt Company Ltd. in Finland and/or other countries worldwide. All other trademarks are property of their respective owners.