
Graphiques avec la galerie QML
Démontre comment utiliser les différents types de graphiques en utilisant qml.
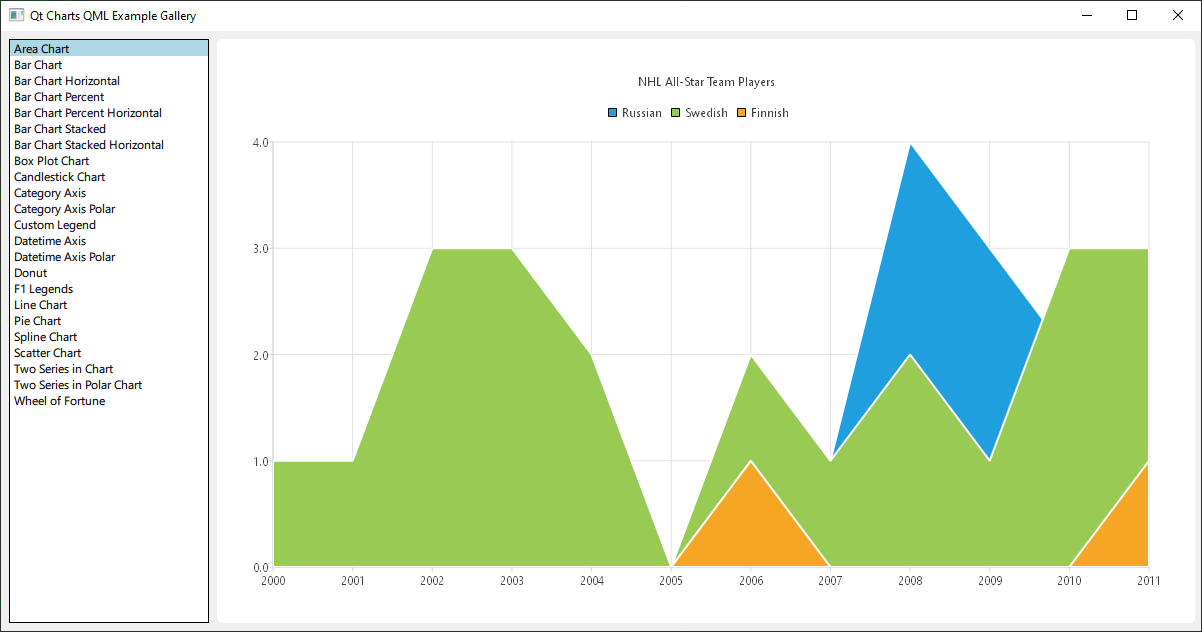
Exécution de l'exemple
Pour exécuter l'exemple à partir de Qt Creatorouvrez le mode Welcome et sélectionnez l'exemple à partir de Examples. Pour plus d'informations, voir Qt Creator: Tutoriel : Construire et exécuter.
Il s'agit d'une application Qt Quick, les fichiers pour chaque type de graphique sont situés dans le répertoire qml du dossier example et sont chargés dans un ListView par main.qml, situé dans ce répertoire examples.
Cette documentation ne se concentrera pas sur la mise en page ou le chargement de haut niveau, mais plutôt sur l'utilisation de l'API QML de Qt Charts.
Inclure les dépendances
Tous les fichiers .qml commencent par :
import QtQuick
import QtCharts
Création de graphiques avec QML
La création de chaque type de graphique commence par la création d'un fichier ChartView.
Pour créer un diagramme circulaire, nous utilisons l'API PieSeries ainsi que quelques PieSlices :
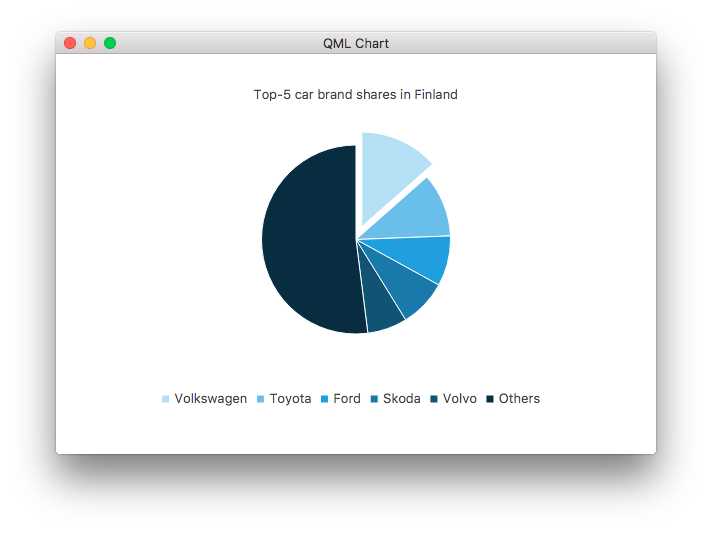
ChartView {
    id: chart
    title: "Top-5 car brand shares in Finland"
    anchors.fill: parent
    legend.alignment: Qt.AlignBottom
    antialiasing: true

    property variant othersSlice: 0

    PieSeries {
        id: pieSeries
        PieSlice { label: "Volkswagen"; value: 13.5 }
        PieSlice { label: "Toyota"; value: 10.9 }
        PieSlice { label: "Ford"; value: 8.6 }
        PieSlice { label: "Skoda"; value: 8.2 }
        PieSlice { label: "Volvo"; value: 6.8 }
    }

    Component.onCompleted: {
        // You can also manipulate slices dynamically, like append a slice or set a slice exploded
        othersSlice = pieSeries.append("Others", 52.0);
        pieSeries.find("Volkswagen").exploded = true;
    }
}
Vous pouvez créer un graphique avec une série de lignes :
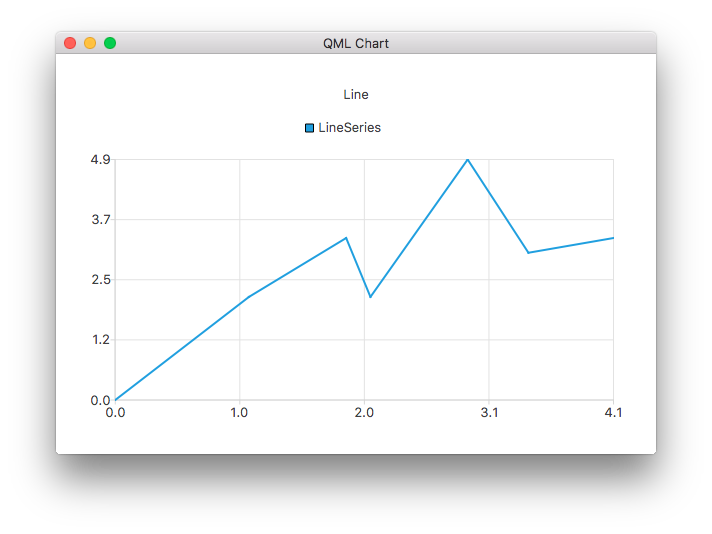
ChartView {
    title: "Line Chart"
    anchors.fill: parent
    antialiasing: true

    LineSeries {
        name: "Line"
        XYPoint { x: 0; y: 0 }
        XYPoint { x: 1.1; y: 2.1 }
        XYPoint { x: 1.9; y: 3.3 }
        XYPoint { x: 2.1; y: 2.1 }
        XYPoint { x: 2.9; y: 4.9 }
        XYPoint { x: 3.4; y: 3.0 }
        XYPoint { x: 4.1; y: 3.3 }
    }
}
et une série de splines :
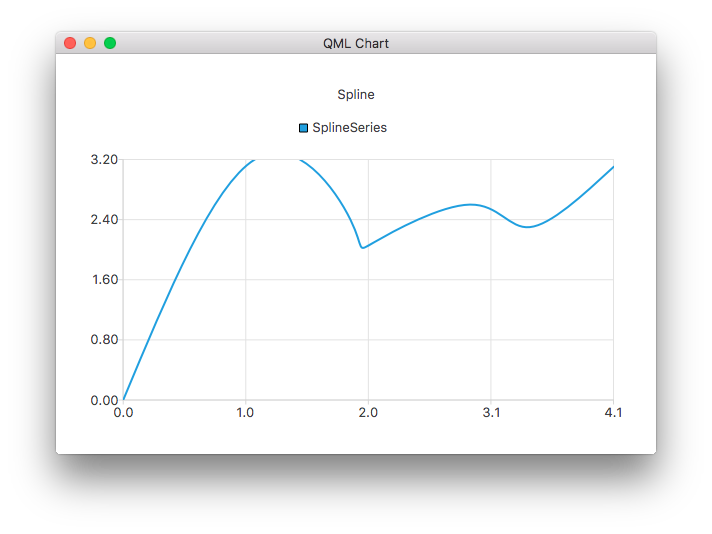
ChartView {
    title: "Spline Chart"
    anchors.fill: parent
    antialiasing: true

    SplineSeries {
        name: "Spline"
        XYPoint { x: 0; y: 0.0 }
        XYPoint { x: 1.1; y: 3.2 }
        XYPoint { x: 1.9; y: 2.4 }
        XYPoint { x: 2.1; y: 2.1 }
        XYPoint { x: 2.9; y: 2.6 }
        XYPoint { x: 3.4; y: 2.3 }
        XYPoint { x: 4.1; y: 3.1 }
    }
}
Vous pouvez créer un graphique illustrant les sélections des joueurs All-Star de la NHL en utilisant trois séries de surfaces :
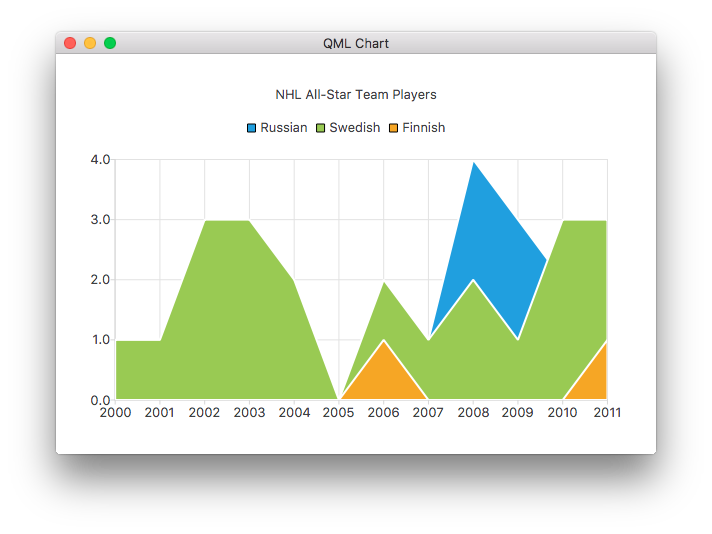
ChartView {
    title: "NHL All-Star Team Players"
    anchors.fill: parent
    antialiasing: true

    // Define x-axis to be used with the series instead of default one
    ValueAxis {
        id: valueAxis
        min: 2000
        max: 2011
        tickCount: 12
        labelFormat: "%.0f"
    }

    AreaSeries {
        name: "Russian"
        axisX: valueAxis
        upperSeries: LineSeries {
            XYPoint { x: 2000; y: 1 }
            XYPoint { x: 2001; y: 1 }
            XYPoint { x: 2002; y: 1 }
            XYPoint { x: 2003; y: 1 }
            XYPoint { x: 2004; y: 1 }
            XYPoint { x: 2005; y: 0 }
            XYPoint { x: 2006; y: 1 }
            XYPoint { x: 2007; y: 1 }
            XYPoint { x: 2008; y: 4 }
            XYPoint { x: 2009; y: 3 }
            XYPoint { x: 2010; y: 2 }
            XYPoint { x: 2011; y: 1 }
        }
    }
    ...
puis quelques séries de dispersion :
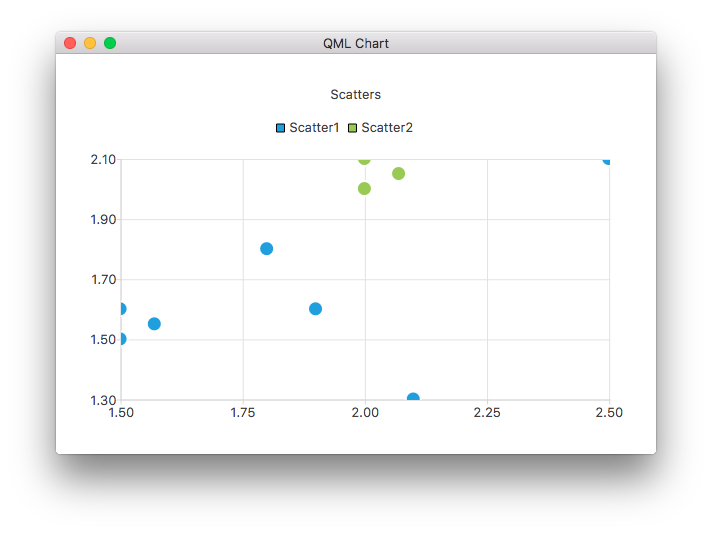
ChartView {
    title: "Scatter Chart"
    anchors.fill: parent
    antialiasing: true

    ScatterSeries {
        id: scatter1
        name: "Scatter A"
        XYPoint { x: 1.5; y: 1.5 }
        XYPoint { x: 1.5; y: 1.6 }
        XYPoint { x: 1.57; y: 1.55 }
        XYPoint { x: 1.8; y: 1.8 }
        XYPoint { x: 1.9; y: 1.6 }
        XYPoint { x: 2.1; y: 1.3 }
        XYPoint { x: 2.5; y: 2.1 }
    }

    ScatterSeries {
        name: "Scatter B"
        XYPoint { x: 2.0; y: 2.0 }
        XYPoint { x: 2.0; y: 2.1 }
        XYPoint { x: 2.07; y: 2.05 }
        XYPoint { x: 2.2; y: 2.9 }
        XYPoint { x: 2.4; y: 2.7 }
        XYPoint { x: 2.67; y: 2.65 }
    }
}
    ...
et quelques séries de barres différentes :
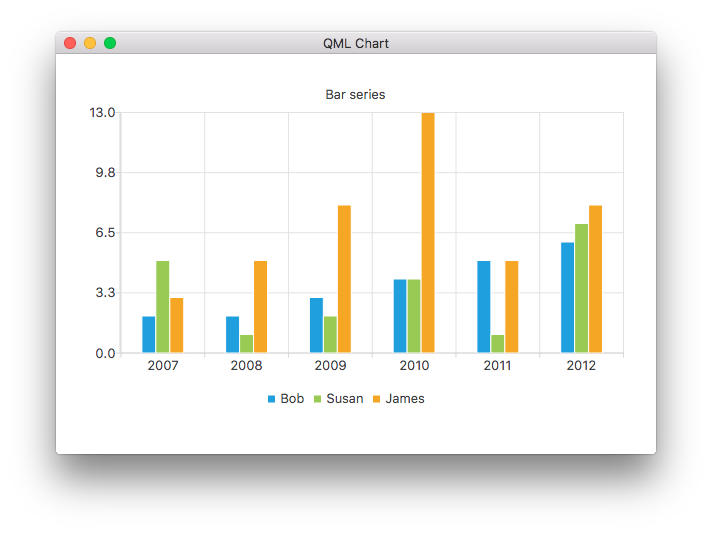
ChartView {
    title: "Bar Chart"
    anchors.fill: parent
    legend.alignment: Qt.AlignBottom
    antialiasing: true

    BarSeries {
        id: mySeries
        axisX: BarCategoryAxis { categories: ["2007", "2008", "2009", "2010", "2011", "2012" ] }
        BarSet { label: "Bob"; values: [2, 2, 3, 4, 5, 6] }
        BarSet { label: "Susan"; values: [5, 1, 2, 4, 1, 7] }
        BarSet { label: "James"; values: [3, 5, 8, 13, 5, 8] }
    }
}
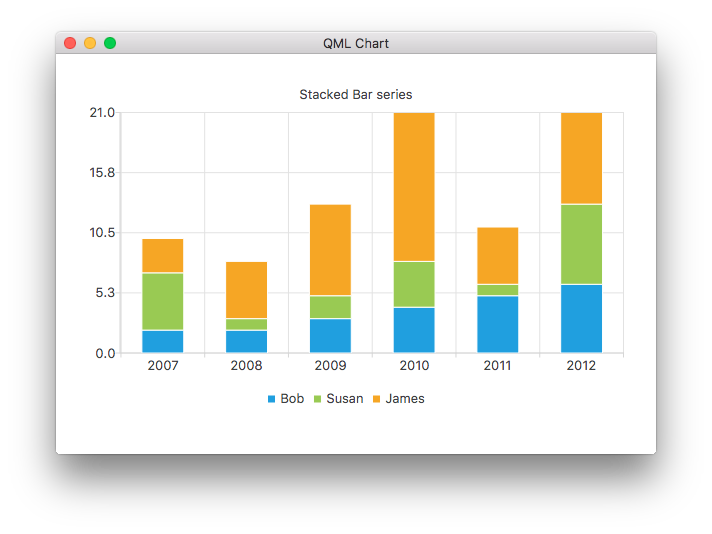
ChartView {
    title: "Stacked Bar Chart"
    anchors.fill: parent
    legend.alignment: Qt.AlignBottom
    antialiasing: true

    StackedBarSeries {
        axisX: BarCategoryAxis { categories: ["2007", "2008", "2009", "2010", "2011", "2012" ] }
        BarSet { label: "Bob"; values: [2, 2, 3, 4, 5, 6] }
        BarSet { label: "Susan"; values: [5, 1, 2, 4, 1, 7] }
        BarSet { label: "James"; values: [3, 5, 8, 13, 5, 8] }
    }
}
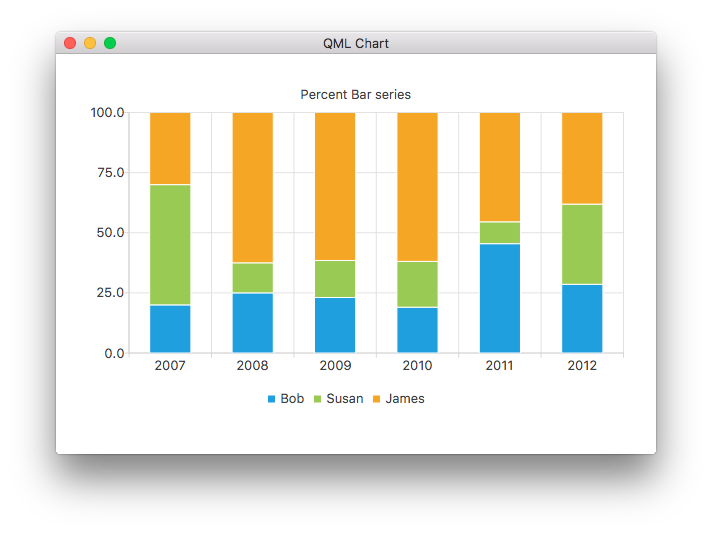
ChartView {
    title: "Percent Bar Chart"
    anchors.fill: parent
    legend.alignment: Qt.AlignBottom
    antialiasing: true

    PercentBarSeries {
        axisX: BarCategoryAxis { categories: ["2007", "2008", "2009", "2010", "2011", "2012" ] }
        BarSet { label: "Bob"; values: [2, 2, 3, 4, 5, 6] }
        BarSet { label: "Susan"; values: [5, 1, 2, 4, 1, 7] }
        BarSet { label: "James"; values: [3, 5, 8, 13, 5, 8] }
    }
}
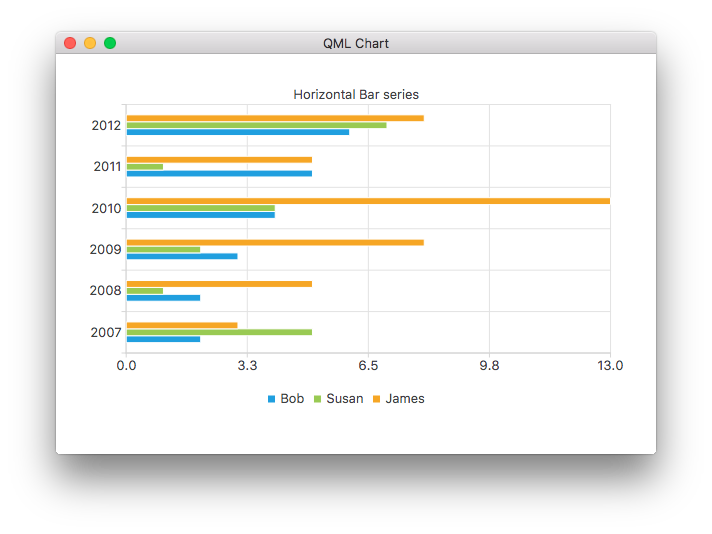
ChartView {
    title: "Horizontal Bar Chart"
    anchors.fill: parent
    legend.alignment: Qt.AlignBottom
    antialiasing: true

    HorizontalBarSeries {
        axisY: BarCategoryAxis { categories: ["2007", "2008", "2009", "2010", "2011", "2012" ] }
        BarSet { label: "Bob"; values: [2, 2, 3, 4, 5, 6] }
        BarSet { label: "Susan"; values: [5, 1, 2, 4, 1, 7] }
        BarSet { label: "James"; values: [3, 5, 8, 13, 5, 8] }
    }
}
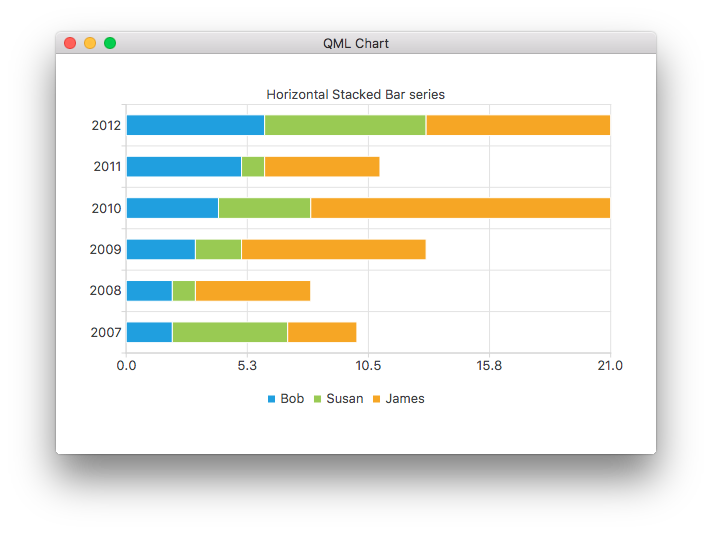
ChartView {
    title: "Horizontal Stacked Bar Chart"
    anchors.fill: parent
    legend.alignment: Qt.AlignBottom
    antialiasing: true

    HorizontalStackedBarSeries {
        axisY: BarCategoryAxis { categories: ["2007", "2008", "2009", "2010", "2011", "2012" ] }
        BarSet { label: "Bob"; values: [2, 2, 3, 4, 5, 6] }
        BarSet { label: "Susan"; values: [5, 1, 2, 4, 1, 7] }
        BarSet { label: "James"; values: [3, 5, 8, 13, 5, 8] }
    }
}
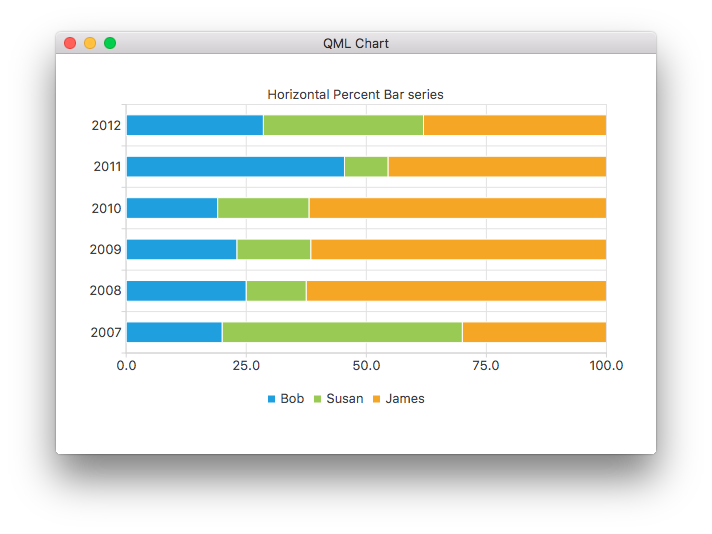
ChartView {
    title: "Horizontal Percent Bar Chart"
    anchors.fill: parent
    legend.alignment: Qt.AlignBottom
    antialiasing: true

    HorizontalPercentBarSeries {
        axisY: BarCategoryAxis { categories: ["2007", "2008", "2009", "2010", "2011", "2012" ] }
        BarSet { label: "Bob"; values: [2, 2, 3, 4, 5, 6] }
        BarSet { label: "Susan"; values: [5, 1, 2, 4, 1, 7] }
        BarSet { label: "James"; values: [3, 5, 8, 13, 5, 8] }
    }
}
Voici comment créer un graphique en forme de beignet à l'aide de deux séries de camemberts :
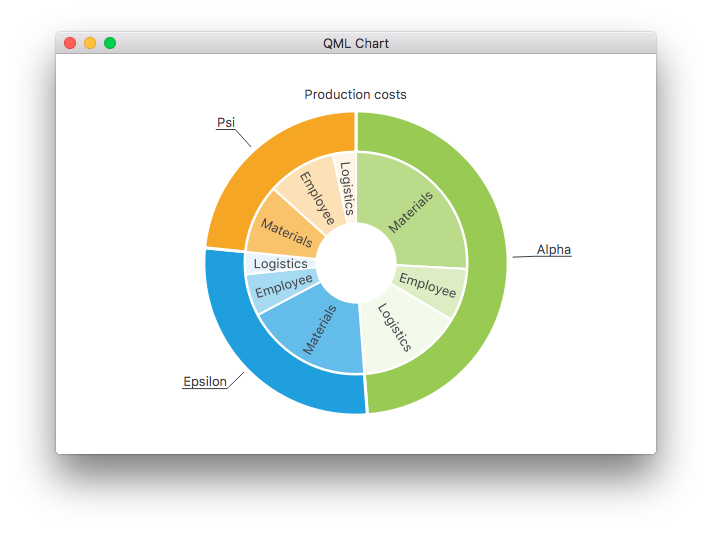
ChartView {
    id: chart
    title: "Production Costs"
    anchors.fill: parent
    legend.visible: false
    antialiasing: true

    PieSeries {
        id: pieOuter
        size: 0.96
        holeSize: 0.7
        PieSlice { id: slice; label: "Alpha"; value: 19511; color: "#99CA53" }
        PieSlice { label: "Epsilon"; value: 11105; color: "#209FDF" }
        PieSlice { label: "Psi"; value: 9352; color: "#F6A625" }
    }

    PieSeries {
        size: 0.7
        id: pieInner
        holeSize: 0.25

        PieSlice { label: "Materials"; value: 10334; color: "#B9DB8A" }
        PieSlice { label: "Employee"; value: 3066; color: "#DCEDC4" }
        PieSlice { label: "Logistics"; value: 6111; color: "#F3F9EB" }

        PieSlice { label: "Materials"; value: 7371; color: "#63BCE9" }
        PieSlice { label: "Employee"; value: 2443; color: "#A6D9F2" }
        PieSlice { label: "Logistics"; value: 1291; color: "#E9F5FC" }

        PieSlice { label: "Materials"; value: 4022; color: "#F9C36C" }
        PieSlice { label: "Employee"; value: 3998; color: "#FCE1B6" }
        PieSlice { label: "Logistics"; value: 1332; color: "#FEF5E7" }
    }

    Component.onCompleted: {
        // Set the common slice properties dynamically for convenience
        for (var i = 0; i < pieOuter.count; i++) {
            pieOuter.at(i).labelPosition = PieSlice.LabelOutside;
            pieOuter.at(i).labelVisible = true;
            pieOuter.at(i).borderWidth = 3;
        }
        for (var i = 0; i < pieInner.count; i++) {
            pieInner.at(i).labelPosition = PieSlice.LabelInsideNormal;
            pieInner.at(i).labelVisible = true;
            pieInner.at(i).borderWidth = 2;
        }
    }
}
De plus, l'anticrénelage est défini par la propriété qml dans Qt Quick 2.
Autres graphiques
Les liens suivants permettent de découvrir les autres graphiques de cet exemple d'application.
Montre comment personnaliser les différentes propriétés visuelles d'un ChartView et d'une série. | |
Montre comment créer votre propre légende personnalisée. | |
Démontre comment utiliser les axes dans votre application QML. | |
Implémente un graphique F1 Legends pour démontrer que les modèles de liste sont des sources de données. | |
Montre comment créer différents graphiques polaires dans votre application QML. |
© 2025 The Qt Company Ltd. Documentation contributions included herein are the copyrights of their respective owners. The documentation provided herein is licensed under the terms of the GNU Free Documentation License version 1.3 as published by the Free Software Foundation. Qt and respective logos are trademarks of The Qt Company Ltd. in Finland and/or other countries worldwide. All other trademarks are property of their respective owners.
