
Personalización de las vistas de gráficos con QML
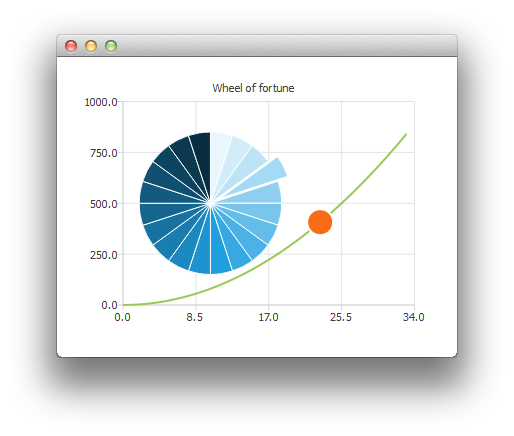
Nota: Esto forma parte del ejemplo «Galería de gráficos con QML ».
Aquí te mostramos cómo crear una rueda de la fortuna personalizando una serie de gráficos circulares.
En primer lugar, creamos el ChartView y un par de series.
ChartView {
    id: chartView
    anchors.fill: parent
    title: "Wheel of Fortune"
    legend.visible: false
    antialiasing: true

    PieSeries {
        id: wheelOfFortune
        horizontalPosition: 0.3
    }

    SplineSeries {
        id: splineSeries
    }

    ScatterSeries {
        id: scatterSeries
    }
}
Los datos de la aplicación se generan en Component.onCompleted del rectángulo principal:
Component.onCompleted: {
    __intervalCoefficient = Math.random() + 0.25;

    for (var i = 0; i < 20; i++)
        wheelOfFortune.append("", 1);

    var interval = 1;
    for (var j = 0; interval < 800; j++) {
        interval = __intervalCoefficient * j * j;
        splineSeries.append(j, interval);
    }
    chartView.axisX(scatterSeries).max = j;
    chartView.axisY(scatterSeries).max = 1000;
}
Las siguientes personalizaciones se realizan de forma repetida mediante un temporizador. Para resaltar una de las porciones del gráfico circular cada vez, modificamos su propiedad «exploded»:
wheelOfFortune.at(index).exploded = false;
root.__activeIndex++;
index = root.__activeIndex % wheelOfFortune.count;
wheelOfFortune.at(index).exploded = true;
A continuación, se aplica una animación utilizando una serie de puntos dispersos con un único punto de datos:
scatterSeries.clear();
scatterSeries.append(root.__activeIndex, interval);
scatterSeries.color = Qt.tint(scatterSeries.color, "#05FF0000");
scatterSeries.markerSize += 0.5;
Cuando la rueda de la fortuna se ha detenido, hacemos que el sector activo parpadee modificando sus colores.
// Switch the colors of the slice and the border
wheelOfFortune.at(index).borderWidth = 2;
switchColor = wheelOfFortune.at(index).borderColor;
wheelOfFortune.at(index).borderColor = wheelOfFortune.at(index).color;
wheelOfFortune.at(index).color = switchColor;
© 2026 The Qt Company Ltd. Documentation contributions included herein are the copyrights of their respective owners. The documentation provided herein is licensed under the terms of the GNU Free Documentation License version 1.3 as published by the Free Software Foundation. Qt and respective logos are trademarks of The Qt Company Ltd. in Finland and/or other countries worldwide. All other trademarks are property of their respective owners.
