
Personnalisation des affichages de graphiques avec QML
Remarque : ceci fait partie de l'exemple « Charts with QML Gallery ».
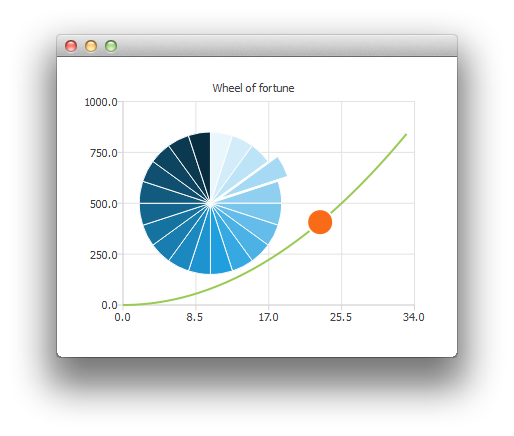
Nous allons vous montrer ici comment créer une roue de la fortune en personnalisant une série de graphiques circulaires.
Nous commençons par créer la vue ChartView et quelques séries.
ChartView {
    id: chartView
    anchors.fill: parent
    title: "Wheel of Fortune"
    legend.visible: false
    antialiasing: true

    PieSeries {
        id: wheelOfFortune
        horizontalPosition: 0.3
    }

    SplineSeries {
        id: splineSeries
    }

    ScatterSeries {
        id: scatterSeries
    }
}
Les données de l'application sont générées dans la méthode Component.onCompleted du rectangle principal :
Component.onCompleted: {
    __intervalCoefficient = Math.random() + 0.25;

    for (var i = 0; i < 20; i++)
        wheelOfFortune.append("", 1);

    var interval = 1;
    for (var j = 0; interval < 800; j++) {
        interval = __intervalCoefficient * j * j;
        splineSeries.append(j, interval);
    }
    chartView.axisX(scatterSeries).max = j;
    chartView.axisY(scatterSeries).max = 1000;
}
Les personnalisations suivantes sont effectuées de manière répétée à l'aide d'un minuteur. Pour mettre en surbrillance une des parts du graphique circulaire à la fois, nous modifions sa propriété « exploded » :
wheelOfFortune.at(index).exploded = false;
root.__activeIndex++;
index = root.__activeIndex % wheelOfFortune.count;
wheelOfFortune.at(index).exploded = true;
Ensuite, une animation utilisant une série de points avec un seul point de données :
scatterSeries.clear();
scatterSeries.append(root.__activeIndex, interval);
scatterSeries.color = Qt.tint(scatterSeries.color, "#05FF0000");
scatterSeries.markerSize += 0.5;
Lorsque la roue de la fortune s'est arrêtée, nous faisons clignoter la part active en modifiant ses couleurs.
// Switch the colors of the slice and the border
wheelOfFortune.at(index).borderWidth = 2;
switchColor = wheelOfFortune.at(index).borderColor;
wheelOfFortune.at(index).borderColor = wheelOfFortune.at(index).color;
wheelOfFortune.at(index).color = switchColor;
© 2026 The Qt Company Ltd. Documentation contributions included herein are the copyrights of their respective owners. The documentation provided herein is licensed under the terms of the GNU Free Documentation License version 1.3 as published by the Free Software Foundation. Qt and respective logos are trademarks of The Qt Company Ltd. in Finland and/or other countries worldwide. All other trademarks are property of their respective owners.
