
Cockpit
Exemple d’application imitant le cockpit d’un avion à l’aide de graphiques.
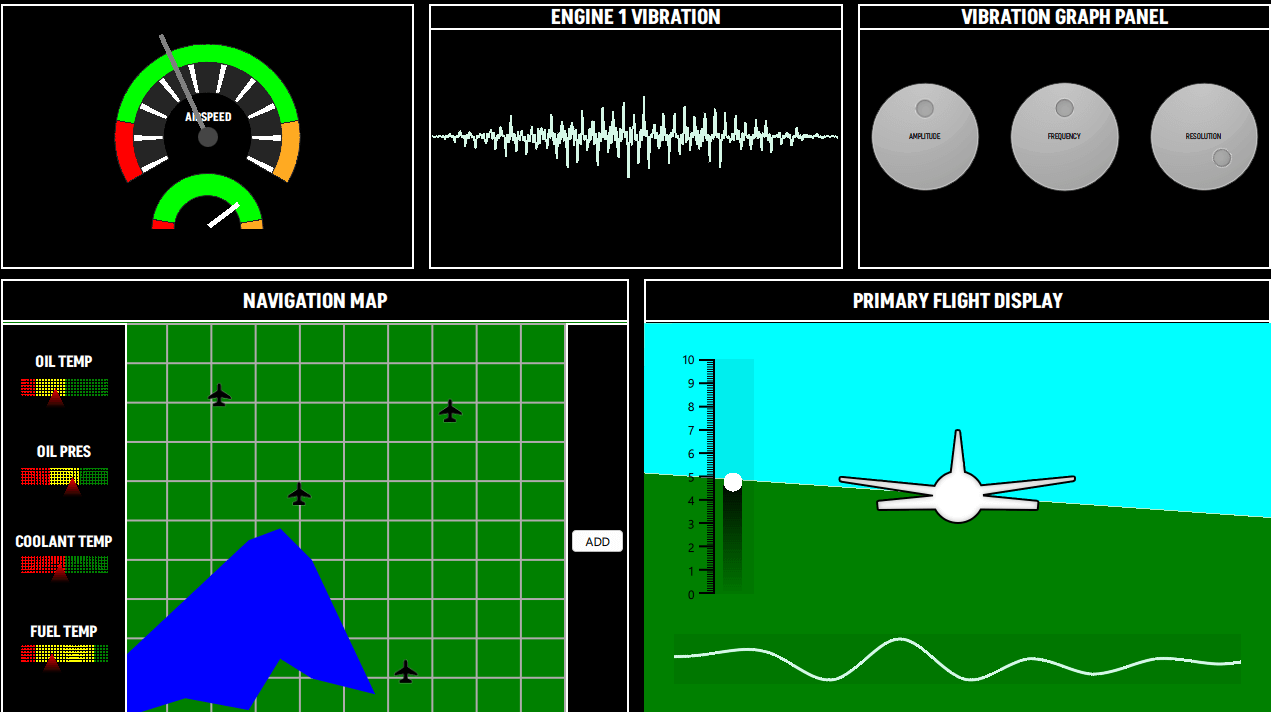
L'exemple du cockpit utilise plusieurs types de graphiques différents pour dessiner des écrans de contrôle d'avion fictifs. Les graphiques utilisés dans cet exemple sont les suivants :
- PieSeries (Compteur de vitesse)
- LineSeries (Panneau de vibrations, carte de navigation)
- AreaSeries (Carte de navigation, écran de vol principal)
- BarSeries (Carte de navigation, écran de vol principal)
- ScatterSeries (Carte de navigation)
- SplineSeries (Écran de vol principal)
Exécution de l’exemple
Vous pouvez exécuter l'exemple à partir de :
- Qt Creator
Ouvrez le mode « Welcome » et sélectionnez l'exemple dans « Examples ». Pour plus d'informations, consultez Qt Creator: Tutoriel : Compiler et exécuter.
- Qt Extension for Visual Studio Code
Exécutez la commande ` Qt: Open Qt examples ` à partir de Command Palette, puis sélectionnez l'exemple dans la liste. Pour plus d'informations, consultez Qt Extension for Visual Studio Code: Tutoriel : Compiler et exécuter.
Compteur de vitesse
La vue « compteur de vitesse » se compose de 3 éléments « PieSeries » à l’intérieur d’un seul « GraphsView », avec des rectangles QML servant d’aiguilles pour les deux cadrans.
La propriété `backgroundVisible` de l’ GraphsTheme est définie sur ` false`. Tous les ` PieSlices ` ont leurs propres couleurs personnalisées. Pour afficher une échelle circulaire avec un centre creux, l’exemple utilise des ` PieSeries ` avec différentes valeurs de `holeSize`.
GraphsView {
    id: chart
    anchors.fill: parent
    anchors.margins: 20

    theme: GraphsTheme {
        backgroundVisible: false
        borderColors: ["#252525"]
    }

    PieSeries {
        id: pieOuter
        pieSize: 1
        holeSize: 0.8
        startAngle: -120
        endAngle: 120

        PieSlice { label: "Stall"; value: 1; color: "#ff0000"; labelVisible: false }
        PieSlice { label: "Optimal"; value: 4; color: "#00ff00"; labelVisible: false }
        PieSlice { label: "Overspeed"; value: 1; color: "#ffaa22"; labelVisible: false }
    }

    PieSeries {
        pieSize: 0.8
        holeSize: 0.6
        startAngle: -120
        endAngle: 120

        PieSlice { value: 1; color: "#ffffff"; }
        PieSlice { value: 4; color: "#252525"; }
        PieSlice { value: 1; color: "#ffffff"; }
        PieSlice { value: 4; color: "#252525"; }
        PieSlice { value: 1; color: "#ffffff"; }
        PieSlice { value: 4; color: "#252525"; }
        PieSlice { value: 1; color: "#ffffff"; }
        PieSlice { value: 4; color: "#252525"; }
        PieSlice { value: 1; color: "#ffffff"; }
        PieSlice { value: 4; color: "#252525"; }
        PieSlice { value: 1; color: "#ffffff"; }
        PieSlice { value: 4; color: "#252525"; }
        PieSlice { value: 1; color: "#ffffff"; }
        PieSlice { value: 4; color: "#252525"; }
        PieSlice { value: 1; color: "#ffffff"; }
        PieSlice { value: 4; color: "#252525"; }
        PieSlice { value: 1; color: "#ffffff"; }
        PieSlice { value: 4; color: "#252525"; }
        PieSlice { value: 1; color: "#ffffff"; }
    }

    PieSeries {
        pieSize: 0.6
        holeSize: 1.0
        startAngle: -120
        endAngle: 120
        verticalPosition: 1

        PieSlice { label: "Stall"; value: 1; color: "#ff0000"; labelVisible: false }
        PieSlice { label: "Optimal"; value: 4; color: "#00ff00"; labelVisible: false  }
        PieSlice { label: "Overspeed"; value: 1; color: "#ffaa22"; labelVisible: false  }
    }
}
Panneau de vibration
Le panneau « Vibration » contient une « LineSeries » qui est mise à jour dynamiquement lors de l’exécution. Après le lancement, un ensemble de points est ajouté à la série à l’aide de la fonction « append » invoquée depuis QML. Ensuite, à chaque image, les valeurs sont remplacées par des valeurs calculées à l’aide de la fonction « replace ». Les utilisateurs peuvent modifier ces valeurs via le panneau « Vibration Graph ».
LineSeries {
    id: line
    property int divisions: 500
    property real amplitude: 0.5
    property real resolution: 0.5

    FrameAnimation {
        running: true

        onTriggered: {
            for (let i = 0; i < line.divisions; ++i) {
                let y = Math.sin(line.resolution*i)
                y *= Math.cos(i)
                y *= Math.sin(i / line.divisions * 3.2) * 3 * line.amplitude * Math.random()

               line.replace(i, (i/line.divisions) * 8.0, y + 4)
            }
        }
    }

    Component.onCompleted: {
        for (let i = 1; i <= divisions; ++i) {
            append((i/divisions) * 8.0, 4.0)
        }
    }

    function change(newDivs) {
        let delta = newDivs - divisions

        if (delta < 0) {
            delta = Math.abs(delta)
            removeMultiple(count - 1 - delta, delta)
        } else {
            for (let i = 0; i < delta; ++i) {
                append(((count + i)/divisions) * 8.0, 4.0)
            }
        }

        divisions = newDivs
    }
}
Panneau « Graphique des vibrations »
Ce panneau contient des boutons de commande permettant de régler les valeurs qui influencent la visualisation affichée dans le panneau « Vibration ».
Carte de navigation
La carte de navigation comporte deux sections principales :
- Le panneau de gauche contient plusieurs « BarSeries » dotés d’un shader personnalisé qui utilise la couleur « BarSets » pour ombrer chacune des barres.
BarSeries { property real barOpacity: 0. id: barSeries barsType: BarSeries.BarsType.Stacked barWidth: 0.2 barDelegate: Item { id: delegate antialiasing: true property real barOpacity: 0.5 property color barColor property string barLabel FrameAnimation { running: true onTriggered: { delegate.barOpacity = Math.abs(Math.sin(elapsedTime)) } } ShaderEffect { id: effect readonly property alias iTime: delegate.barOpacity readonly property alias iColor: delegate.barColor readonly property vector3d iResolution: Qt.vector3d(width, height, 1.0) blending: true fragmentShader: 'bar.frag.qsb' anchors.fill: parent } } BarSet { id: set1; label: "Low"; values: [1, 2, 3, 1]; color: "red" } BarSet { id: set2; label: "Medium"; values: [2, 2, 0, 4]; color: "yellow"} BarSet { id: set3; label: "High"; values: [3, 2, 3, 1]; color: "green"} } - Le panneau de droite contient :
- Un « AreaSeries » (modèle de données) comportant deux « LineSeries » (éléments de données) permet de visualiser un lac fictif.
- Une « ScatterSeries » superposée affiche des icônes personnalisées, par exemple des aéroports, sur une carte.
- Le bouton « ADD » ajoute une LineSeries dont les points peuvent être déplacés pour créer un tracé. Cette LineSeries utilise un shader personnalisé pour le « pointDelegate » et l’« ScatterSeries » utilise une image.
AreaSeries {
    property double x: 0
    property double y: 0

    id: lake1
    color: "blue"
    upperSeries: LineSeries {
        id: s1
        XYPoint { x: 0.0; y: -3.5 }
        XYPoint { x: 1.0; y: -5.0 }
        XYPoint { x: 2.0; y: -2.5 }
        XYPoint { x: 2.5; y: -4.0 }
        XYPoint { x: 3.0; y: -4.2 }
    }

    lowerSeries: LineSeries {
        id: s2
        XYPoint { x: 0.0; y: -7.2 }
        XYPoint { x: 1.0; y: -7.0 }
        XYPoint { x: 2.0; y: -8.5 }
        XYPoint { x: 2.5; y: -8.0 }
        XYPoint { x: 3.0; y: -9.0 }
        XYPoint { x: 4.0; y: -6.5 }
    }
}

AreaSeries {
    property double x: 0
    property double y: 0

    id: lake2
    color: "blue"
    upperSeries: LineSeries {
        id: s3
        XYPoint { x: 0.0; y: 1.5 }
        XYPoint { x: 1.0; y: 3.0 }
        XYPoint { x: 2.0; y: 4.5 }
        XYPoint { x: 2.5; y: 4.8 }
        XYPoint { x: 3.0; y: 4.0 }
    }

    lowerSeries: LineSeries {
        id: s4
        XYPoint { x: 0.0; y: 0.0 }
        XYPoint { x: 1.0; y: 0.5 }
        XYPoint { x: 2.0; y: 0.2 }
        XYPoint { x: 2.5; y: 1.5 }
        XYPoint { x: 3.0; y: 1.0 }
        XYPoint { x: 4.0; y: 0.6 }
    }
}

// POI
ScatterSeries {
    name: "Airport"

    pointDelegate: Image {
            source: "airplane-ico.png"
            mipmap: true
            width: 30
            height: 30
    }

    XYPoint{x: 4.0; y: 5.7}
    XYPoint{x: 2.2; y: 8.2}
    XYPoint{x: 6.4; y: 1.2}
    XYPoint{x: 7.4; y: 7.8}
}

LineSeries {
    id: linePath
    selectable: true
    draggable: true
    color: "white"
    pointDelegate: Item {
        width: 50
        height: 50
        property real pointValueX
        property real pointValueY

        FrameAnimation {
            id: scatterAnim
            running: true
        }

        ShaderEffect {
            readonly property vector3d iResolution: Qt.vector3d(width, height, 1.0)
            readonly property alias iTime: scatterAnim.elapsedTime

            blending: true
            fragmentShader: 'circleMarker.frag.qsb'
            anchors.fill: parent
        }

        Text {
            color: "white"
            font.pointSize: 4
            text: "LAT: " + pointValueX.toFixed(1) + ", " + "LON: " + pointValueY.toFixed(1)
        }
    }
}
Affichage de vol principal
L'affichage de vol principal propose une simulation de la vue « 3D » du relief. Il est mis en œuvre à l'aide de deux AreaSeries qui représentent respectivement le sol et le ciel, chacune avec des couleurs personnalisées. Une FrameAnimation met à jour les valeurs de ces séries.
AreaSeries {
    id: upperArea
    color: "cyan"

    upperSeries: LineSeries {
        XYPoint {x: 0; y: 10}
        XYPoint {x: 10; y: 10}
    }

    lowerSeries: LineSeries {
        id: upperLine
        XYPoint {x: 0; y: 3}
        XYPoint {x: 10; y: 4}
    }
}

FrameAnimation {
    running: true
    onTriggered: {
        upperLine.replace(0, upperLine.at(0).x, Math.sin(elapsedTime) + 6)
        upperLine.replace(1, upperLine.at(1).x, Math.cos(elapsedTime) + 6)
        lowerLine.replace(0, lowerLine.at(0).x, Math.sin(elapsedTime) + 6)
        lowerLine.replace(1, lowerLine.at(1).x, Math.cos(elapsedTime) + 6)
        barSet.values = [Math.sin(elapsedTime) + 5]
    }
}
Sur le côté gauche, une « BarSeries » thématique affiche les étiquettes de l’axe y. Cette « BarSeries » utilise également un shader personnalisé pour la barre.
BarSeries {
    id: barSeries
    selectable: true
    barDelegate: Item {
        id: delegate
        antialiasing: true
        property real barOpacity: 0.5
        property color barColor
        property string barLabel

        ShaderEffect {
            id: effect
            readonly property vector3d iResolution: Qt.vector3d(width, height, 1.0)

            blending: true
            fragmentShader: 'pitchbar.frag.qsb'
            anchors.fill: parent
        }
    }

    BarSet { id: barSet; values: []; selectedColor: "red" }
}
Au bas de la vue, une SplineSeries permet de visualiser l’altitude du terrain sous l’avion. L’ SplineSeries est mise à jour à chaque image. Le code qui met à jour la série ajoute à la fin et supprime du début une série continue de points. Au survol, l’ SplineSeries affiche une info-bulle indiquant la valeur de l’axe y (altitude).
GraphsView {
    anchors.fill: parent
    anchors.leftMargin: -90
    anchors.rightMargin: -80
    anchors.bottomMargin: -30

    theme: GraphsTheme {
        backgroundVisible: false
        plotAreaBackgroundColor: "#11000000"
    }

    axisX: ValueAxis {
        max: 10
        subTickCount: 9
        lineVisible: false
        gridVisible: false
        subGridVisible: false
        labelsVisible: false
        visible: false
    }

    axisY: ValueAxis {
        max: 10
        subTickCount: 9
        lineVisible: false
        gridVisible: false
        subGridVisible: false
        labelsVisible: false
        visible: false
    }

    ToolTip {
        id: tooltip
    }

    onHoverEnter: {
        tooltip.visible = true;
    }

    onHoverExit: {
        tooltip.visible = false;
    }

    onHover: (seriesName, position, value) => {
                 tooltip.x = position.x + 1;
                 tooltip.y = position.y + 1;
                 tooltip.text = "Altitude: " + (value.y * 1000).toFixed(1) + "m";
             }

    FrameAnimation {
        property var points: []

        Component.onCompleted: {
            for (let i = 0; i < altitudeLine.count; ++i) {
                points[i] = altitudeLine.at(i)
            }
        }

        running: true
        onTriggered: {
            for (let i = 0; i < points.length; ++i) {
                points[i].x -= frameTime

                if (points[1].x <= -2) {
                    let p = points[0]
                    p.x = points[points.length - 1].x + 1
                    altitudeLine.append(p)
                    altitudeLine.remove(0)

                    points.length = 0

                    for (let i = 0; i < altitudeLine.count; ++i) {
                        points[i] = altitudeLine.at(i)
                    }
                }
            }
            altitudeLine.replace(points)
            altitudeLine.update()
        }
    }

    SplineSeries {
        id: altitudeLine
        hoverable: true
        width: 3

        XYPoint {x: 0; y: 5}
        XYPoint {x: 1; y: 2}
        XYPoint {x: 2; y: 5}
        XYPoint {x: 3; y: 4}
        XYPoint {x: 4; y: 6}
        XYPoint {x: 5; y: 7}
        XYPoint {x: 6; y: 9}
        XYPoint {x: 7; y: 8}
        XYPoint {x: 8; y: 9}
        XYPoint {x: 9; y: 6}
        XYPoint {x: 10; y: 6}
        XYPoint {x: 11; y: 6}
        XYPoint {x: 12; y: 1}
        XYPoint {x: 13; y: 9}
        XYPoint {x: 14; y: 1}
    }

}© 2026 The Qt Company Ltd. Documentation contributions included herein are the copyrights of their respective owners. The documentation provided herein is licensed under the terms of the GNU Free Documentation License version 1.3 as published by the Free Software Foundation. Qt and respective logos are trademarks of The Qt Company Ltd. in Finland and/or other countries worldwide. All other trademarks are property of their respective owners.
