Using Logarithmic Value Axes
Note: This is part of the Charts with Widgets Gallery example.
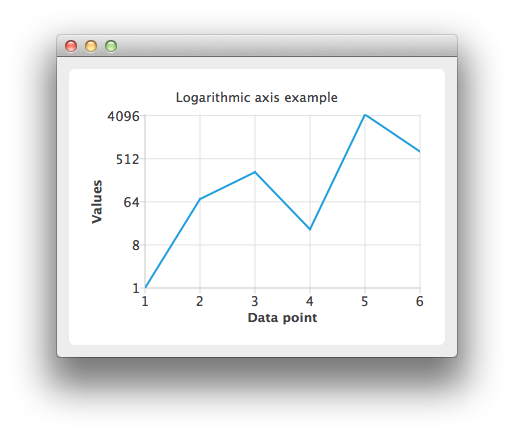
Create a QLineSeries instance and add some data to it.
auto series = new QLineSeries;
*series << QPointF(1.0, 1.0) << QPointF(2.0, 73.0) << QPointF(3.0, 268.0) << QPointF(4.0, 17.0)
        << QPointF(5.0, 4325.0) << QPointF(6.0, 723.0);
To present the data on the chart we need a QChart instance. Add the series to it, hide the legend and set the title of the chart.
auto chart = new QChart;
chart->addSeries(series);
chart->legend()->hide();
chart->setTitle("Logarithmic Axis");
Create the axes. Add them to the chart and attach to the series.
auto axisX = new QValueAxis;
axisX->setTitleText("Data point");
axisX->setLabelFormat("%i");
axisX->setTickCount(series->count());
chart->addAxis(axisX, Qt::AlignBottom);
series->attachAxis(axisX);

auto axisY = new QLogValueAxis;
axisY->setTitleText("Values");
axisY->setLabelFormat("%g");
axisY->setBase(8.0);
axisY->setMinorTickCount(-1);
chart->addAxis(axisY, Qt::AlignLeft);
series->attachAxis(axisY);
Then create a QChartView object with QChart as a parameter.
createDefaultChartView(chart);
The chart is ready to be shown.
© 2026 The Qt Company Ltd. Documentation contributions included herein are the copyrights of their respective owners. The documentation provided herein is licensed under the terms of the GNU Free Documentation License version 1.3 as published by the Free Software Foundation. Qt and respective logos are trademarks of The Qt Company Ltd. in Finland and/or other countries worldwide. All other trademarks are property of their respective owners.
