CSV 数据图表
如何在Qt Graphs 中可视化 CSV 文件中的数据。
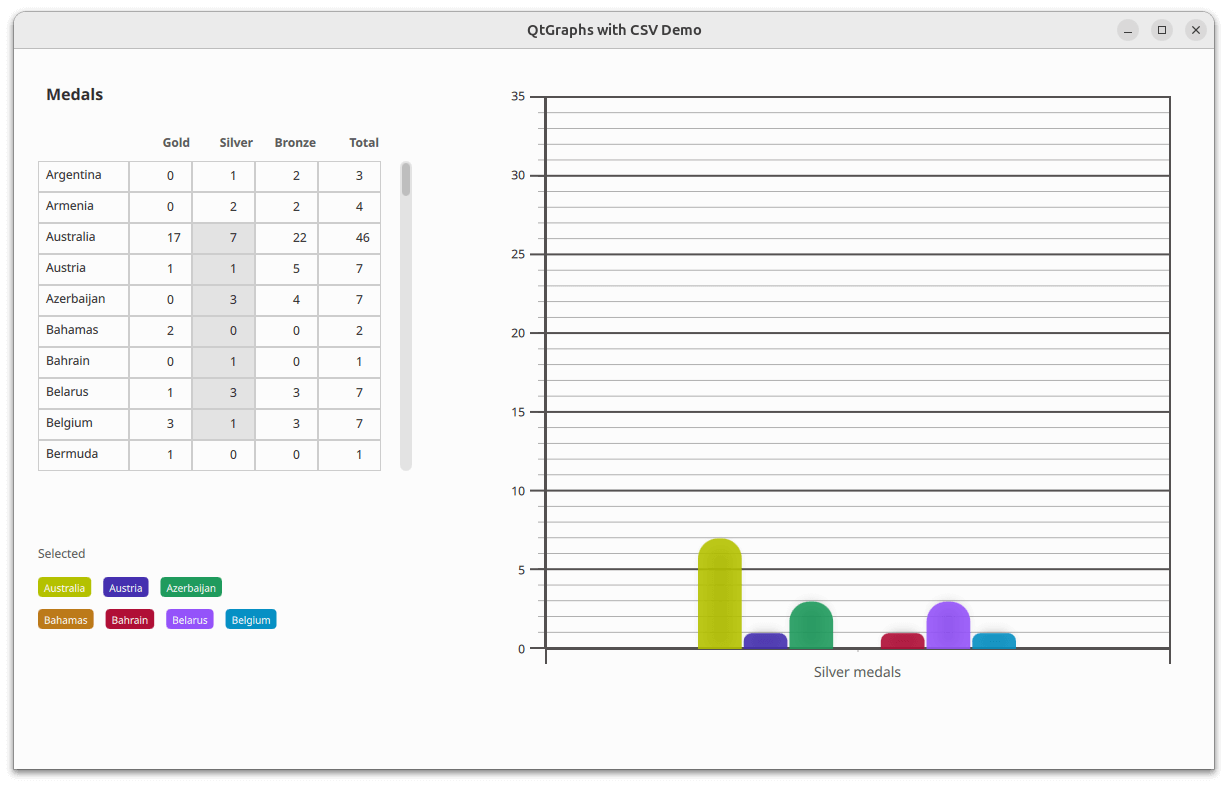
带有 CSV 数据的图表示例展示了如何在二维条形图中显示 CSV 文件中的数据。应用程序使用第三方 CSV 解析器读取 CSV 文件。数据被插入到继承自QAbstractTableModel 的自定义模型中。数据被插入模型后,最左边的一列包含垂直标题数据,最上面一行包含水平标题数据。
选定的第三方库对Qt 资源系统一无所知,因此无法从文件路径加载 CSV 文件。因此,在将源文件传递给库之前,必须先加载源文件的内容。本例中的 CSV 库接受文件路径、std::fstream 或std::stringstream 。由于 CSV 文件在 Qt 资源中,库不知道如何加载它,而QFile 又不支持std::fstream ;剩下的唯一选择就是使用std::stringstream 。可以通过QFile::readAll() 将整个文件读入一个字符串,然后将该字符串打开到std::stringstream 中。
在应用程序窗口中,表格视图显示模型中的数据。用户可以从表格视图中选择一个数据分段,然后将其显示在条形图中。
由于条形图系列不会修改类别坐标轴标签,因此更新系列也不会更新坐标轴标签。这需要通过 JavaScript 从模型最左侧的列中提取标签名称来处理。然后将提取的标签名称设置为类别轴的标签属性。
    function extractBarSetGategories(first, count) {
        let categories = [];
        const last = first + count;
        for (let i = first; i < last; ++i)
            categories.push(tv.model.headerData(i, Qt.Horizontal, Qt.DisplayRole) + " medals");
        return categories;
    }
运行示例
要从 Qt Creator,打开Welcome 模式并从Examples 中选择示例。更多信息,请参见Qt Creator: 教程:构建并运行。
另请参阅 QML 应用程序。
© 2026 The Qt Company Ltd. Documentation contributions included herein are the copyrights of their respective owners. The documentation provided herein is licensed under the terms of the GNU Free Documentation License version 1.3 as published by the Free Software Foundation. Qt and respective logos are trademarks of The Qt Company Ltd. in Finland and/or other countries worldwide. All other trademarks are property of their respective owners.
