MapItemView 过渡 (QML)
如何将过渡效果与MapItemView 结合使用。

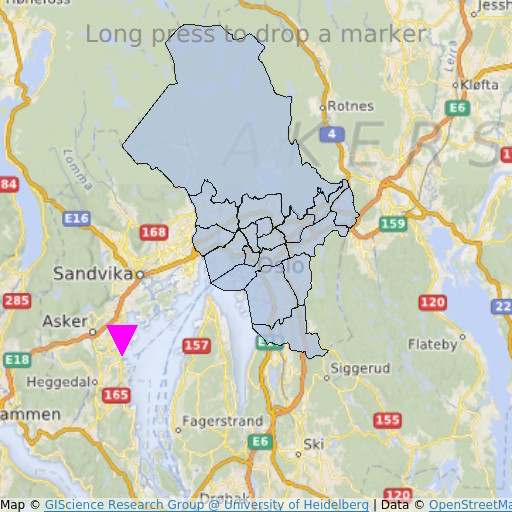
MapItemView Transitions演示了如何使用Map 项目来渲染地图。它显示了显示地图所需的最少代码量,可作为进一步实验的基础。
运行示例
要从 Qt Creator,打开Welcome 模式并从Examples 中选择示例。更多信息,请参阅Qt Creator: 教程:构建并运行。
QML 代码
在main.qml 中,使用了两个 MapItemView元素,用于在地图上添加奥斯陆地区的行政区,以及在长按时添加标记。
MapItemView {
    id: mivMarker

    add: Transition {
        NumberAnimation {
            property: "slideIn"
            from: 50
            to: 0
            duration: 500
            easing.type: Easing.OutBounce
            easing.amplitude: 3.0
        }
    }

    remove: Transition {
        NumberAnimation {
            property: "opacity"
            to: 0.1
            duration: 50
        }
    }

    model: ListModel {
        id: markerModel
    }
    delegate: Component {
        MapQuickItem {
            coordinate: QtPositioning.coordinate(latitude, longitude)
            anchorPoint: Qt.point(e1.width * 0.5, e1.height + slideIn)
            property real slideIn : 0
            sourceItem: Shape {
                id: e1
                vendorExtensionsEnabled: false
                width: 32
                height: 32
                visible: true

                transform: Scale {
                    origin.y: e1.height * 0.5
                    yScale: -1
                }

                ShapePath {
                    id: c_sp1
                    strokeWidth: -1
                    fillColor: Qt.rgba(1,0,1,1.0)

                    property real half: e1.width * 0.5
                    property real quarter: e1.width * 0.25
                    property point center: Qt.point(e1.x + e1.width * 0.5 , e1.y + e1.height * 0.5)

                    property point top: Qt.point(center.x, center.y - half )
                    property point bottomLeft: Qt.point(center.x - half, center.y + half )
                    property point bottomRight: Qt.point(center.x + half, center.y + half )

                    startX: center.x;
                    startY: center.y + half

                    PathLine { x: c_sp1.bottomLeft.x; y: c_sp1.bottomLeft.y }
                    PathLine { x: c_sp1.top.x; y: c_sp1.top.y }
                    PathLine { x: c_sp1.bottomRight.x; y: c_sp1.bottomRight.y }
                    PathLine { x: c_sp1.center.x; y: c_sp1.center.y + c_sp1.half }
                }
            }
        }
    }
}
标记视图同时指定了添加和移除过渡,以创建弹跳标记效果。
MapItemView {
    id: miv
    model: OsloListModel {
        id: osloListModel
    }
    add: Transition {
        NumberAnimation {
            property: "animationScale"
            from: 0.2
            to: 1
            duration: 800
            easing.type: Easing.OutCubic
        }
    }
    delegate: Component {
        MapPolygon {
            function fromMercator(l, centroid) {
                var res = []
                for (var i  = 0; i < l.length; i++) {
                    var vtx = l[i]
                    var offset = Qt.point((vtx.x - centroid.x) * animationScale,
                                          (vtx.y - centroid.y) * animationScale)
                    var pt = Qt.point(centroid.x + offset.x, centroid.y + offset.y)
                    res.push( QtPositioning.mercatorToCoord(pt) )
                }
                return res;
            }

            path: fromMercator(osloListModel.geometries[name+"_"+adminLevel]
                               , osloListModel.centroids[name+"_"+adminLevel] )
            color: ((adminLevel > 4) ? "lightsteelblue" : 'firebrick')
            property real animationScale : 1
            opacity: ((adminLevel < 9) ? 0.1 : 0.8)
            visible: true
        }
    }
}
行政区视图只指定了添加过渡,以创建行政区增长效果。
要求
该示例需要正常的互联网连接,以便下载OpenStreetMap 地图图块。可选的系统代理会自动下载。
© 2025 The Qt Company Ltd. Documentation contributions included herein are the copyrights of their respective owners. The documentation provided herein is licensed under the terms of the GNU Free Documentation License version 1.3 as published by the Free Software Foundation. Qt and respective logos are trademarks of The Qt Company Ltd. in Finland and/or other countries worldwide. All other trademarks are property of their respective owners.

