
Qt Quick 2 Scatter Example
Using Scatter3D in a QML application.
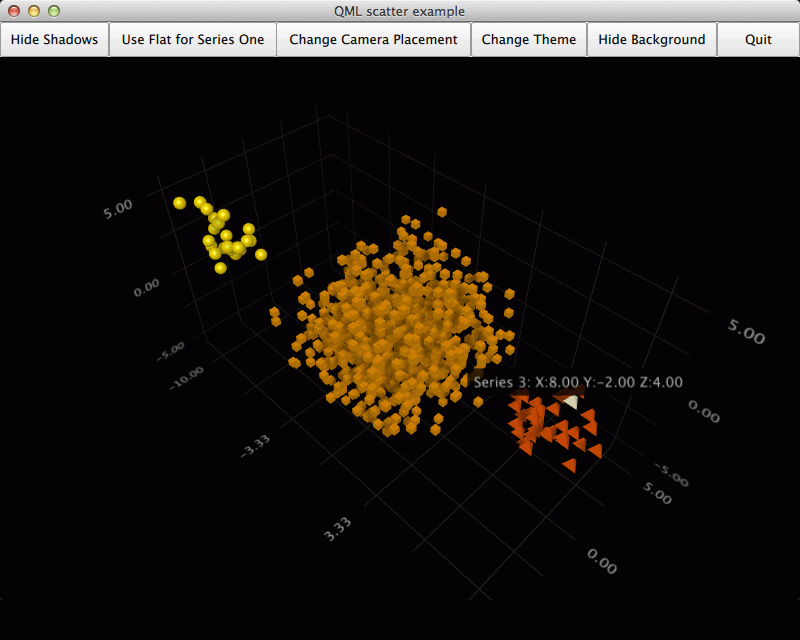
The Qt Quick 2 scatter example shows how to make a simple scatter graph visualization using Scatter3D and Qt Quick 2.
For instructions about how to interact with the graph, see this page .
For instructions how to create a new Qt Quick 2 application of your own, see Qt Creator help.
Running the Example
To run the example from Qt Creator , open the Welcome mode and select the example from Examples . For more information, visit Building and Running an Example.
Application Basics
Before diving into the QML code, let’s take a look at the application
main.cpp.This application implements a ‘Quit’ button in the UI, so we want to connect the
quit()signal to our application’sclose()slot:QObject::connect(viewer.engine(), &QQmlEngine::quit, &viewer, &QWindow::close);To make deployment little simpler, we gather all of the application’s
.qmlfiles to a resource file (qmlscatter.qrc):<RCC> <qresource prefix="/"> <file>qml/qmlscatter/Data.qml</file> <file>qml/qmlscatter/main.qml</file> <file>qml/qmlscatter/NewButton.qml</file> </qresource> </RCC>This also requires us to set the
main.qmlto be read from the resource (qrc:):viewer.setSource(QUrl("qrc:/qml/qmlscatter/main.qml"));Lastly, we want the application to run in a maximized window:
viewer.showMaximized();
Setting up the Graph
First we’ll import all the QML modules we need:
import QtQuick 2.1
import QtQuick.Layouts 1.0
import QtDataVisualization 1.0
import "."
The last
importjust imports all the qml files in the same directory as ourmain.qml, because that’s whereNewButton.qmlandData.qmlare.Then we create our main
Rectangleand call itmainView:Rectangle { id: mainViewThen we’ll add another
Iteminside the mainRectangle, and call itdataView. This will be the item to hold the Scatter3D graph. We’ll anchor it to the parent bottom:Item { id: dataView anchors.bottom: parent.bottomNext we’re ready to add the Scatter3D graph itself. We’ll add it inside the
dataViewand name itscatterGraph. Let’s make it fill thedataView:Scatter3D { id: scatterGraph width: dataView.width height: dataView.heightNow the graph is ready for use, but has no data. It also has the default axes and visual properties.
Let’s modify some visual properties first by adding the following inside
scatterGraph:theme: themeIsabelle shadowQuality: AbstractGraph3D.ShadowQualitySoftLowWe added a customized theme and changed the shadow quality. We’re happy with the other visual properties, so we won’t change them.
The custom theme is based on a predefined theme, but we change the font in it:
Theme3D {
    id: themeIsabelle
    type: Theme3D.ThemeIsabelle
    font.family: "Lucida Handwriting"
    font.pointSize: 40
}
Then it’s time to start feeding the graph some data.
Adding Data to the Graph
Let’s create a
Dataitem inside themainViewand name itseriesData:Data { id: seriesData }The
seriesDataitem contains the data models for all three series we use in this example.This is the component that holds our data in
Data.qml. It has anItemas the main component.In the main component we’ll add the data itself in a
ListModeland name itdataModel:ListModel { id: dataModel ListElement{ xPos: -10.0; yPos: 5.0; zPos: -5.0 } ...We’ll add two more of these for the other two series, and name them
dataModelTwoanddataModelThree.Then we need to expose the data models to be usable from
main.qml. We do this by defining them as aliases in the main data component:property alias model: dataModel property alias modelTwo: dataModelTwo property alias modelThree: dataModelThreeNow we can use the data from
Data.qmlwithscatterGraphinmain.qml. First we’ll add a Scatter3DSeries and call itscatterSeries:Scatter3DSeries { id: scatterSeriesThen we’ll set up selection label format for the series:
itemLabelFormat: "Series 1: X:@xLabel Y:@yLabel Z:@zLabel"And finally the data for series one in a ItemModelScatterDataProxy . We set the data itself as
itemModelfor the proxy:ItemModelScatterDataProxy { itemModel: seriesData.model xPosRole: "xPos" yPosRole: "yPos" zPosRole: "zPos" }We’ll add the other two series in the same way, but modify some series-specific details a bit:
Scatter3DSeries { id: scatterSeriesTwo itemLabelFormat: "Series 2: X:@xLabel Y:@yLabel Z:@zLabel" itemSize: 0.1 mesh: Abstract3DSeries.MeshCube ...Then we’ll modify the properties of the default axes in
scatterGrapha bit:axisX.segmentCount: 3 axisX.subSegmentCount: 2 axisX.labelFormat: "%.2f" axisZ.segmentCount: 2 axisZ.subSegmentCount: 2 axisZ.labelFormat: "%.2f" axisY.segmentCount: 2 axisY.subSegmentCount: 2 axisY.labelFormat: "%.2f"After that we’ll just add a few buttons to the
mainViewto control the graph. We’ll only show one as an example:NewButton { id: shadowToggle Layout.fillHeight: true Layout.fillWidth: true text: scatterGraph.shadowsSupported ? "Hide Shadows" : "Shadows not supported" enabled: scatterGraph.shadowsSupported onClicked: { if (scatterGraph.shadowQuality === AbstractGraph3D.ShadowQualityNone) { scatterGraph.shadowQuality = AbstractGraph3D.ShadowQualitySoftLow; text = "Hide Shadows"; } else { scatterGraph.shadowQuality = AbstractGraph3D.ShadowQualityNone; text = "Show Shadows"; } } }Then we’ll modify
dataViewto make room for the buttons at the top:Item { id: dataView anchors.bottom: parent.bottom width: parent.width height: parent.height - buttonLayout.height ...And we’re done!
Example Contents
© 2022 The Qt Company Ltd. Documentation contributions included herein are the copyrights of their respective owners. The documentation provided herein is licensed under the terms of the GNU Free Documentation License version 1.3 as published by the Free Software Foundation. Qt and respective logos are trademarks of The Qt Company Ltd. in Finland and/or other countries worldwide. All other trademarks are property of their respective owners.