
Previous topic
Next topic
QAbstractBarSeries
The QAbstractBarSeries class is an abstract parent class for all bar series classes. More…
Inherited by: QStackedBarSeries, QPercentBarSeries, QHorizontalStackedBarSeries, QHorizontalPercentBarSeries, QHorizontalBarSeries, QBarSeries
Synopsis
Functions
def
append(set)def
append(sets)def
barSets()def
barWidth()def
clear()def
count()def
insert(index, set)def
isLabelsVisible()def
labelsAngle()def
labelsFormat()def
labelsPosition()def
labelsPrecision()def
remove(set)def
setBarWidth(width)def
setLabelsAngle(angle)def
setLabelsFormat(format)def
setLabelsPosition(position)def
setLabelsPrecision(precision)def
setLabelsVisible([visible=true])def
take(set)
Signals
def
barsetsAdded(sets)def
barsetsRemoved(sets)def
clicked(index, barset)def
countChanged()def
doubleClicked(index, barset)def
hovered(status, index, barset)def
labelsAngleChanged(angle)def
labelsFormatChanged(format)def
labelsPositionChanged(position)def
labelsPrecisionChanged(precision)def
labelsVisibleChanged()def
pressed(index, barset)def
released(index, barset)
Detailed Description
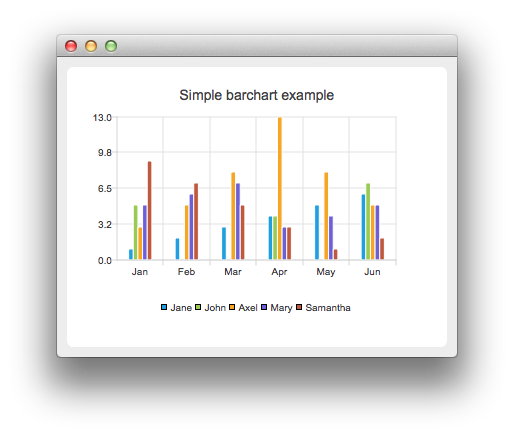
In bar charts, bars are defined as bar sets that contain one data value for each category. The position of a bar is specified by the category and its height by the data value. Bar series that contain multiple bar sets group together bars that belong to the same category. The way the bars are displayed is determined by the subclass of this class chosen to create the bar chart.
If a QValueAxis is used instead of QBarCategoryAxis for the main bar axis, the bars are grouped around the index value of the category.
See the bar chart example to learn how to use the QBarSeries class to create a simple bar chart.
- class PySide6.QtCharts.QAbstractBarSeries
- PySide6.QtCharts.QAbstractBarSeries.LabelsPosition
This enum value describes the position of the data value labels:
Constant
Description
QAbstractBarSeries.LabelsCenter
Label is located in the center of the bar.
QAbstractBarSeries.LabelsInsideEnd
Label is located inside the bar at the top.
QAbstractBarSeries.LabelsInsideBase
Label is located inside the bar at the bottom.
QAbstractBarSeries.LabelsOutsideEnd
Label is located outside the bar at the top.
- PySide6.QtCharts.QAbstractBarSeries.append(sets)
- Parameters
sets –
- Return type
bool
- PySide6.QtCharts.QAbstractBarSeries.append(set)
- Parameters
set –
PySide6.QtCharts.QBarSet- Return type
bool
Adds a set of bars specified by set to the bar series and takes ownership of it. If the set is null or it already belongs to the series, it will not be appended. Returns true if appending succeeded.
- PySide6.QtCharts.QAbstractBarSeries.barSets()
- Return type
Returns a list of bar sets in a bar series. Keeps the ownership of the bar sets.
- PySide6.QtCharts.QAbstractBarSeries.barWidth()
- Return type
float
This property holds The width of the bars of the series..
The unit of width is the unit of the x-axis. The minimum width for bars is zero, and negative values are treated as zero. Setting the width to zero means that the width of the bar on the screen is one pixel regardless of the scale of the x-axis. Bars wider than zero are scaled using the x-axis scale.
Note
When used with QBarSeries , this value specifies the width of a group of bars instead of that of a single bar.
See also
- PySide6.QtCharts.QAbstractBarSeries.barsetsAdded(sets)
- Parameters
sets –
- PySide6.QtCharts.QAbstractBarSeries.barsetsRemoved(sets)
- Parameters
sets –
- PySide6.QtCharts.QAbstractBarSeries.clear()
Removes all bar sets from the series and permanently deletes them.
- PySide6.QtCharts.QAbstractBarSeries.clicked(index, barset)
- Parameters
index – int
barset –
PySide6.QtCharts.QBarSet
- PySide6.QtCharts.QAbstractBarSeries.count()
- Return type
int
This property holds The number of bar sets in a bar series..
- PySide6.QtCharts.QAbstractBarSeries.countChanged()
- PySide6.QtCharts.QAbstractBarSeries.doubleClicked(index, barset)
- Parameters
index – int
barset –
PySide6.QtCharts.QBarSet
- PySide6.QtCharts.QAbstractBarSeries.hovered(status, index, barset)
- Parameters
status – bool
index – int
barset –
PySide6.QtCharts.QBarSet
- PySide6.QtCharts.QAbstractBarSeries.insert(index, set)
- Parameters
index – int
set –
PySide6.QtCharts.QBarSet
- Return type
bool
Inserts a bar set specified by set to a series at the position specified by index and takes ownership of the set. If the set is null or already belongs to the series, it will not be appended. Returns true if inserting succeeds.
- PySide6.QtCharts.QAbstractBarSeries.isLabelsVisible()
- Return type
bool
This property holds The visibility of the labels in a bar series..
- PySide6.QtCharts.QAbstractBarSeries.labelsAngle()
- Return type
float
This property holds The angle of the value labels in degrees..
- PySide6.QtCharts.QAbstractBarSeries.labelsAngleChanged(angle)
- Parameters
angle – float
- PySide6.QtCharts.QAbstractBarSeries.labelsFormat()
- Return type
str
This property holds The format used for showing labels in a bar series..
QAbstractBarSeries supports the following format tag:
@value
The value of the bar
For example, the following usage of the format tags would produce labels that show the value followed by the unit (u):
series->setLabelsFormat("@value u");
By default, the labels show the value of the bar. For the percent bar series, % is added after the value. The labels are shown on the plot area, if the bars are close to each other, the labels may overlap.
See also
labelsVisiblelabelsPositionlabelsPrecision
- PySide6.QtCharts.QAbstractBarSeries.labelsFormatChanged(format)
- Parameters
format – str
- PySide6.QtCharts.QAbstractBarSeries.labelsPosition()
- Return type
This property holds The position of value labels..
See also
labelsVisiblelabelsFormat
- PySide6.QtCharts.QAbstractBarSeries.labelsPositionChanged(position)
- Parameters
position –
LabelsPosition
- PySide6.QtCharts.QAbstractBarSeries.labelsPrecision()
- Return type
int
This property holds The maximum amount of significant digits shown in value labels..
Default value is 6.
- PySide6.QtCharts.QAbstractBarSeries.labelsPrecisionChanged(precision)
- Parameters
precision – int
- PySide6.QtCharts.QAbstractBarSeries.labelsVisibleChanged()
- PySide6.QtCharts.QAbstractBarSeries.pressed(index, barset)
- Parameters
index – int
barset –
PySide6.QtCharts.QBarSet
- PySide6.QtCharts.QAbstractBarSeries.released(index, barset)
- Parameters
index – int
barset –
PySide6.QtCharts.QBarSet
- PySide6.QtCharts.QAbstractBarSeries.remove(set)
- Parameters
set –
PySide6.QtCharts.QBarSet- Return type
bool
Removes the bar set specified by set from the series and permanently deletes it if the removal succeeds. Returns true if the set was removed.
- PySide6.QtCharts.QAbstractBarSeries.setBarWidth(width)
- Parameters
width – float
This property holds The width of the bars of the series..
The unit of width is the unit of the x-axis. The minimum width for bars is zero, and negative values are treated as zero. Setting the width to zero means that the width of the bar on the screen is one pixel regardless of the scale of the x-axis. Bars wider than zero are scaled using the x-axis scale.
Note
When used with QBarSeries , this value specifies the width of a group of bars instead of that of a single bar.
See also
- PySide6.QtCharts.QAbstractBarSeries.setLabelsAngle(angle)
- Parameters
angle – float
This property holds The angle of the value labels in degrees..
- PySide6.QtCharts.QAbstractBarSeries.setLabelsFormat(format)
- Parameters
format – str
This property holds The format used for showing labels in a bar series..
QAbstractBarSeries supports the following format tag:
@value
The value of the bar
For example, the following usage of the format tags would produce labels that show the value followed by the unit (u):
series->setLabelsFormat("@value u");
By default, the labels show the value of the bar. For the percent bar series, % is added after the value. The labels are shown on the plot area, if the bars are close to each other, the labels may overlap.
See also
labelsVisiblelabelsPositionlabelsPrecision
- PySide6.QtCharts.QAbstractBarSeries.setLabelsPosition(position)
- Parameters
position –
LabelsPosition
This property holds The position of value labels..
See also
labelsVisiblelabelsFormat
- PySide6.QtCharts.QAbstractBarSeries.setLabelsPrecision(precision)
- Parameters
precision – int
This property holds The maximum amount of significant digits shown in value labels..
Default value is 6.
- PySide6.QtCharts.QAbstractBarSeries.setLabelsVisible([visible=true])
- Parameters
visible – bool
This property holds The visibility of the labels in a bar series..
- PySide6.QtCharts.QAbstractBarSeries.take(set)
- Parameters
set –
PySide6.QtCharts.QBarSet- Return type
bool
Takes a single set from the series. Does not delete the bar set object.
Note
The series remains the barset’s parent object. You must set the parent object to take full ownership.
Returns true if the take operation succeeds.
© 2022 The Qt Company Ltd. Documentation contributions included herein are the copyrights of their respective owners. The documentation provided herein is licensed under the terms of the GNU Free Documentation License version 1.3 as published by the Free Software Foundation. Qt and respective logos are trademarks of The Qt Company Ltd. in Finland and/or other countries worldwide. All other trademarks are property of their respective owners.