
Previous topic
Next topic
QPieSeries
The QPieSeries class presents data in pie charts. More…
Synopsis
Functions
def
__lshift__(slice)def
append(label, value)def
append(slice)def
append(slices)def
clear()def
count()def
holeSize()def
horizontalPosition()def
insert(index, slice)def
isEmpty()def
pieEndAngle()def
pieSize()def
pieStartAngle()def
remove(slice)def
setHoleSize(holeSize)def
setHorizontalPosition(relativePosition)def
setLabelsPosition(position)def
setLabelsVisible([visible=true])def
setPieEndAngle(endAngle)def
setPieSize(relativeSize)def
setPieStartAngle(startAngle)def
setVerticalPosition(relativePosition)def
slices()def
sum()def
take(slice)def
verticalPosition()
Signals
def
added(slices)def
clicked(slice)def
countChanged()def
doubleClicked(slice)def
hovered(slice, state)def
pressed(slice)def
released(slice)def
removed(slices)def
sumChanged()
Detailed Description
A pie series consists of slices that are defined as QPieSlice objects. The slices can have any values as the QPieSeries object calculates the percentage of a slice compared with the sum of all slices in the series to determine the actual size of the slice in the chart.
Pie size and position on the chart are controlled by using relative values that range from 0.0 to 1.0. These relate to the actual chart rectangle.
By default, the pie is defined as a full pie. A partial pie can be created by setting a starting angle and angle span for the series. A full pie is 360 degrees, where 0 is at 12 a’clock.
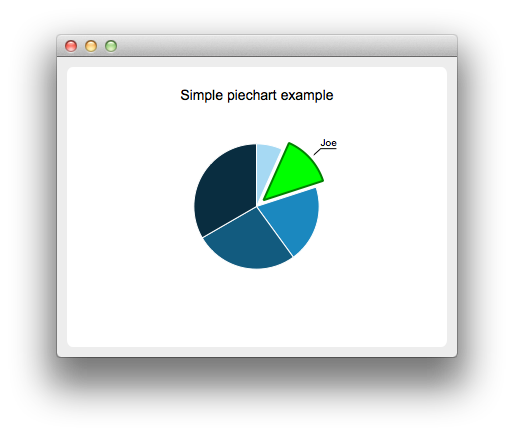
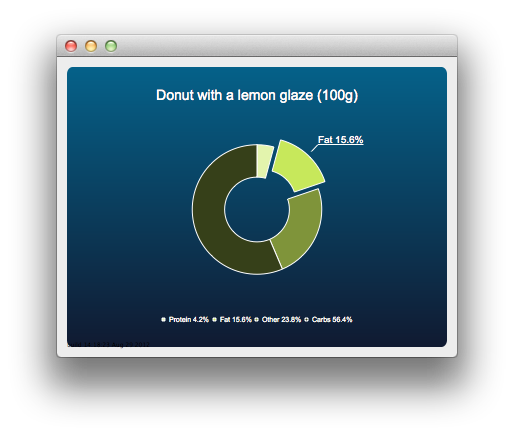
See the pie chart example or donut chart example to learn how to use QPieSeries .
- class PySide6.QtCharts.QPieSeries([parent=None])
- Parameters
parent –
PySide6.QtCore.QObject
Constructs a series object that is a child of parent.
- PySide6.QtCharts.QPieSeries.added(slices)
- Parameters
slices –
- PySide6.QtCharts.QPieSeries.append(slices)
- Parameters
slices –
- Return type
bool
- PySide6.QtCharts.QPieSeries.append(label, value)
- Parameters
label – str
value – float
- Return type
Appends a single slice with the specified value and label to the series. Slice ownership is passed to the series. Returns null if value is NaN, Inf, or -Inf and adds nothing to the series.
- PySide6.QtCharts.QPieSeries.append(slice)
- Parameters
slice –
PySide6.QtCharts.QPieSlice- Return type
bool
Appends the slice specified by slice to the series. Slice ownership is passed to the series.
Returns true if appending succeeds.
- PySide6.QtCharts.QPieSeries.clear()
Clears all slices from the series.
- PySide6.QtCharts.QPieSeries.clicked(slice)
- Parameters
slice –
PySide6.QtCharts.QPieSlice
- PySide6.QtCharts.QPieSeries.count()
- Return type
int
This property holds The number of slices in the series..
- PySide6.QtCharts.QPieSeries.countChanged()
- PySide6.QtCharts.QPieSeries.doubleClicked(slice)
- Parameters
slice –
PySide6.QtCharts.QPieSlice
- PySide6.QtCharts.QPieSeries.holeSize()
- Return type
float
This property holds The donut hole size..
The value is relative to the chart rectangle, so that:
0.0 is the minimum size (full pie drawn without a hole).
1.0 is the maximum size that can fit the chart (the donut has no width).
When setting this property, the size property is adjusted if necessary, to ensure that the hole size is not greater than the pie size.
The default value is 0.0.
- PySide6.QtCharts.QPieSeries.horizontalPosition()
- Return type
float
This property holds The horizontal position of the pie..
The value is relative to the chart rectangle, so that:
0.0 is the absolute left.
1.0 is the absolute right.
The default value is 0.5 (center).
See also
- PySide6.QtCharts.QPieSeries.hovered(slice, state)
- Parameters
slice –
PySide6.QtCharts.QPieSlicestate – bool
- PySide6.QtCharts.QPieSeries.insert(index, slice)
- Parameters
index – int
slice –
PySide6.QtCharts.QPieSlice
- Return type
bool
Inserts the slice specified by slice to the series before the slice at the position specified by index. Slice ownership is passed to the series.
Returns true if inserting succeeds.
- PySide6.QtCharts.QPieSeries.isEmpty()
- Return type
bool
Returns true if the series is empty.
- PySide6.QtCharts.QPieSeries.__lshift__(slice)
- Parameters
slice –
PySide6.QtCharts.QPieSlice- Return type
- PySide6.QtCharts.QPieSeries.pieEndAngle()
- Return type
float
This property holds The ending angle of the pie..
A full pie is 360 degrees, where 0 degrees is at 12 a’clock.
The default value is 360.
- PySide6.QtCharts.QPieSeries.pieSize()
- Return type
float
This property holds The pie size..
The value is relative to the chart rectangle, so that:
0.0 is the minimum size (pie not drawn).
1.0 is the maximum size that can fit the chart.
When setting this property, the holeSize property is adjusted if necessary, to ensure that the hole size is not greater than the pie size.
The default value is 0.7.
- PySide6.QtCharts.QPieSeries.pieStartAngle()
- Return type
float
This property holds The starting angle of the pie..
A full pie is 360 degrees, where 0 degrees is at 12 a’clock.
The default value is 0.
- PySide6.QtCharts.QPieSeries.pressed(slice)
- Parameters
slice –
PySide6.QtCharts.QPieSlice
- PySide6.QtCharts.QPieSeries.released(slice)
- Parameters
slice –
PySide6.QtCharts.QPieSlice
- PySide6.QtCharts.QPieSeries.remove(slice)
- Parameters
slice –
PySide6.QtCharts.QPieSlice- Return type
bool
Removes a single slice, specified by slice, from the series and deletes it permanently.
The pointer cannot be referenced after this call.
Returns true if the removal succeeds.
- PySide6.QtCharts.QPieSeries.removed(slices)
- Parameters
slices –
- PySide6.QtCharts.QPieSeries.setHoleSize(holeSize)
- Parameters
holeSize – float
This property holds The donut hole size..
The value is relative to the chart rectangle, so that:
0.0 is the minimum size (full pie drawn without a hole).
1.0 is the maximum size that can fit the chart (the donut has no width).
When setting this property, the size property is adjusted if necessary, to ensure that the hole size is not greater than the pie size.
The default value is 0.0.
- PySide6.QtCharts.QPieSeries.setHorizontalPosition(relativePosition)
- Parameters
relativePosition – float
This property holds The horizontal position of the pie..
The value is relative to the chart rectangle, so that:
0.0 is the absolute left.
1.0 is the absolute right.
The default value is 0.5 (center).
See also
- PySide6.QtCharts.QPieSeries.setLabelsPosition(position)
- Parameters
position –
LabelPosition
Sets the position of all the slice labels to position.
Note
This function affects only the current slices in the series. If a new slice is added, the default label position is LabelOutside .
See also
- PySide6.QtCharts.QPieSeries.setLabelsVisible([visible=true])
- Parameters
visible – bool
Sets the visibility of all slice labels to visible.
Note
This function affects only the current slices in the series. If a new slice is added, the default label visibility is false.
See also
- PySide6.QtCharts.QPieSeries.setPieEndAngle(endAngle)
- Parameters
endAngle – float
This property holds The ending angle of the pie..
A full pie is 360 degrees, where 0 degrees is at 12 a’clock.
The default value is 360.
- PySide6.QtCharts.QPieSeries.setPieSize(relativeSize)
- Parameters
relativeSize – float
This property holds The pie size..
The value is relative to the chart rectangle, so that:
0.0 is the minimum size (pie not drawn).
1.0 is the maximum size that can fit the chart.
When setting this property, the holeSize property is adjusted if necessary, to ensure that the hole size is not greater than the pie size.
The default value is 0.7.
- PySide6.QtCharts.QPieSeries.setPieStartAngle(startAngle)
- Parameters
startAngle – float
This property holds The starting angle of the pie..
A full pie is 360 degrees, where 0 degrees is at 12 a’clock.
The default value is 0.
- PySide6.QtCharts.QPieSeries.setVerticalPosition(relativePosition)
- Parameters
relativePosition – float
This property holds The vertical position of the pie..
The value is relative to the chart rectangle, so that:
0.0 is the absolute top.
1.0 is the absolute bottom.
The default value is 0.5 (center).
See also
- PySide6.QtCharts.QPieSeries.slices()
- Return type
Returns a list of slices that belong to this series.
- PySide6.QtCharts.QPieSeries.sum()
- Return type
float
This property holds The sum of all slices..
The series keeps track of the sum of all the slices it holds.
- PySide6.QtCharts.QPieSeries.sumChanged()
- PySide6.QtCharts.QPieSeries.take(slice)
- Parameters
slice –
PySide6.QtCharts.QPieSlice- Return type
bool
Takes a single slice, specified by slice, from the series. Does not delete the slice object.
Note
The series remains the slice’s parent object. You must set the parent object to take full ownership.
Returns true if the take operation was successful.
- PySide6.QtCharts.QPieSeries.verticalPosition()
- Return type
float
This property holds The vertical position of the pie..
The value is relative to the chart rectangle, so that:
0.0 is the absolute top.
1.0 is the absolute bottom.
The default value is 0.5 (center).
See also
© 2022 The Qt Company Ltd. Documentation contributions included herein are the copyrights of their respective owners. The documentation provided herein is licensed under the terms of the GNU Free Documentation License version 1.3 as published by the Free Software Foundation. Qt and respective logos are trademarks of The Qt Company Ltd. in Finland and/or other countries worldwide. All other trademarks are property of their respective owners.