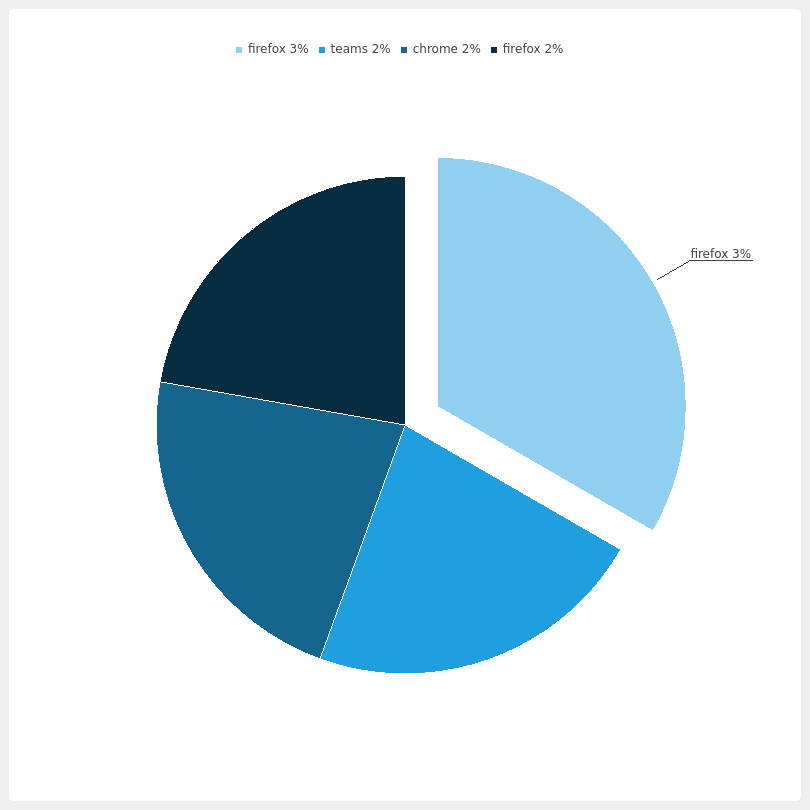
Memory Usag Example
This example shows a QPieChart with the current memory usage in your computer.

"""PySide6 Charts example: Simple memory usage viewer"""

import os
import sys
from PySide6.QtCore import QProcess
from PySide6.QtWidgets import QApplication, QMainWindow
from PySide6.QtCharts import QChart, QChartView, QPieSeries


def run_process(command, arguments):
    process = QProcess()
    process.start(command, arguments)
    process.waitForFinished()
    std_output = process.readAllStandardOutput().data().decode('utf-8')
    return std_output.split('\n')


def get_memory_usage():
    result = []
    if sys.platform == 'win32':
        # Windows: Obtain memory usage in KB from 'tasklist'
        for line in run_process('tasklist', [])[3:]:
            if len(line) >= 74:
                command = line[0:23].strip()
                if command.endswith('.exe'):
                    command = command[0:len(command) - 4]
                memory_usage = float(line[64:74].strip().replace(',', '').replace('.', ''))
                legend = ''
                if memory_usage > 10240:
                    mb = memory_usage / 1024
                    legend = f'{command} {mb}M'
                else:
                    legend = f'{command} {memory_usage}K'
                result.append([legend, memory_usage])
    else:
        # Unix: Obtain memory usage percentage from 'ps'
        ps_options = ['-e', 'v']
        memory_column = 8
        command_column = 9
        if sys.platform == 'darwin':
            ps_options = ['-e', '-v']
            memory_column = 11
            command_column = 12
        for line in run_process('ps', ps_options):
            tokens = line.split(None)
            if len(tokens) > command_column and "PID" not in tokens:  # Percentage and command
                command = tokens[command_column]
                if not command.startswith('['):
                    command = os.path.basename(command)
                    memory_usage = round(float(tokens[memory_column].replace(',', '.')))
                    legend = f'{command} {memory_usage}%'
                    result.append([legend, memory_usage])

    result.sort(key = lambda x: x[1], reverse=True)
    return result


class MainWindow(QMainWindow):

    def __init__(self):
        super().__init__()

        self.setWindowTitle('Memory Usage')

        memory_usage = get_memory_usage()
        if len(memory_usage) > 5:
            memory_usage = memory_usage[0:4]

        self.series = QPieSeries()
        for item in memory_usage:
            self.series.append(item[0], item[1])

        chart_slice = self.series.slices()[0]
        chart_slice.setExploded()
        chart_slice.setLabelVisible()
        self.chart = QChart()
        self.chart.addSeries(self.series)
        self._chart_view = QChartView(self.chart)
        self.setCentralWidget(self._chart_view)


if __name__ == '__main__':
    app = QApplication(sys.argv)
    main_win = MainWindow()
    available_geometry = main_win.screen().availableGeometry()
    size = available_geometry.height() * 3 / 4
    main_win.resize(size, size)
    main_win.show()
    sys.exit(app.exec())
© 2022 The Qt Company Ltd. Documentation contributions included herein are the copyrights of their respective owners. The documentation provided herein is licensed under the terms of the GNU Free Documentation License version 1.3 as published by the Free Software Foundation. Qt and respective logos are trademarks of The Qt Company Ltd. in Finland and/or other countries worldwide. All other trademarks are property of their respective owners.
