
Surface Example
Using Q3DSurface in a widget application.
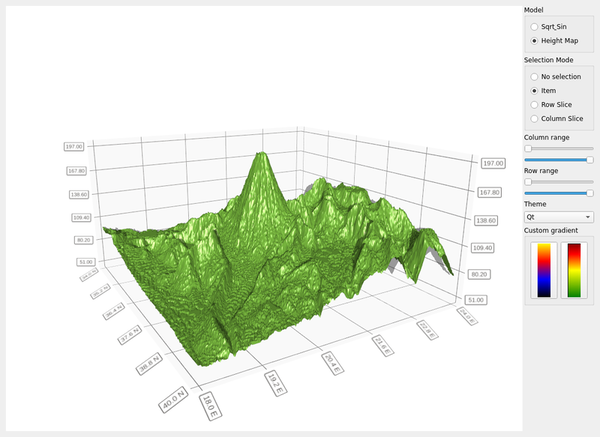
The surface example shows how to make a simple 3D surface graph using Q3DSurface and combining the use of widgets for adjusting several adjustable qualities. This example demonstrates the following features:
How to set up a basic QSurfaceDataProxy and set data for it.
How to use QHeightMapSurfaceDataProxy for showing 3D height maps.
Three different selection modes for studying the graph.
Axis range usage for displaying selected portions of the graph.
Changing theme.
How to set a custom surface gradient.
For instructions about how to interact with the graph, see this page.
import sys

from PySide6.QtCore import QSize, Qt
from PySide6.QtDataVisualization import Q3DSurface
from PySide6.QtGui import QBrush, QIcon, QLinearGradient, QPainter, QPixmap
from PySide6.QtWidgets import (QApplication, QComboBox, QGroupBox, QHBoxLayout,
                               QLabel, QMessageBox, QPushButton, QRadioButton,
                               QSizePolicy, QSlider, QVBoxLayout, QWidget)

from surfacegraph import SurfaceGraph

THEMES = ["Qt", "Primary Colors", "Digia", "Stone Moss", "Army Blue", "Retro", "Ebony", "Isabelle"]


if __name__ == "__main__":
    app = QApplication(sys.argv)
    graph = Q3DSurface()
    container = QWidget.createWindowContainer(graph)

    if not graph.hasContext():
        msgBox = QMessageBox()
        msgBox.setText("Couldn't initialize the OpenGL context.")
        msgBox.exec()
        sys.exit(-1)

    screenSize = graph.screen().size()
    container.setMinimumSize(QSize(screenSize.width() / 2, screenSize.height() / 1.6))
    container.setMaximumSize(screenSize)
    container.setSizePolicy(QSizePolicy.Expanding, QSizePolicy.Expanding)
    container.setFocusPolicy(Qt.StrongFocus)

    widget = QWidget()
    hLayout = QHBoxLayout(widget)
    vLayout = QVBoxLayout()
    hLayout.addWidget(container, 1)
    hLayout.addLayout(vLayout)
    vLayout.setAlignment(Qt.AlignTop)

    widget.setWindowTitle("Surface example")

    modelGroupBox = QGroupBox("Model")

    sqrtSinModelRB = QRadioButton(widget)
    sqrtSinModelRB.setText("Sqrt& Sin")
    sqrtSinModelRB.setChecked(False)

    heightMapModelRB = QRadioButton(widget)
    heightMapModelRB.setText("Height Map")
    heightMapModelRB.setChecked(False)

    modelVBox = QVBoxLayout()
    modelVBox.addWidget(sqrtSinModelRB)
    modelVBox.addWidget(heightMapModelRB)
    modelGroupBox.setLayout(modelVBox)

    selectionGroupBox = QGroupBox("Selection Mode")

    modeNoneRB = QRadioButton(widget)
    modeNoneRB.setText("No selection")
    modeNoneRB.setChecked(False)

    modeItemRB = QRadioButton(widget)
    modeItemRB.setText("Item")
    modeItemRB.setChecked(False)

    modeSliceRowRB = QRadioButton(widget)
    modeSliceRowRB.setText("Row Slice")
    modeSliceRowRB.setChecked(False)

    modeSliceColumnRB = QRadioButton(widget)
    modeSliceColumnRB.setText("Column Slice")
    modeSliceColumnRB.setChecked(False)

    selectionVBox = QVBoxLayout()
    selectionVBox.addWidget(modeNoneRB)
    selectionVBox.addWidget(modeItemRB)
    selectionVBox.addWidget(modeSliceRowRB)
    selectionVBox.addWidget(modeSliceColumnRB)
    selectionGroupBox.setLayout(selectionVBox)

    axisMinSliderX = QSlider(Qt.Horizontal, widget)
    axisMinSliderX.setMinimum(0)
    axisMinSliderX.setTickInterval(1)
    axisMinSliderX.setEnabled(True)
    axisMaxSliderX = QSlider(Qt.Horizontal, widget)
    axisMaxSliderX.setMinimum(1)
    axisMaxSliderX.setTickInterval(1)
    axisMaxSliderX.setEnabled(True)
    axisMinSliderZ = QSlider(Qt.Horizontal, widget)
    axisMinSliderZ.setMinimum(0)
    axisMinSliderZ.setTickInterval(1)
    axisMinSliderZ.setEnabled(True)
    axisMaxSliderZ = QSlider(Qt.Horizontal, widget)
    axisMaxSliderZ.setMinimum(1)
    axisMaxSliderZ.setTickInterval(1)
    axisMaxSliderZ.setEnabled(True)

    themeList = QComboBox(widget)
    themeList.addItems(THEMES)

    colorGroupBox = QGroupBox("Custom gradient")

    grBtoY = QLinearGradient(0, 0, 1, 100)
    grBtoY.setColorAt(1.0, Qt.black)
    grBtoY.setColorAt(0.67, Qt.blue)
    grBtoY.setColorAt(0.33, Qt.red)
    grBtoY.setColorAt(0.0, Qt.yellow)

    pm = QPixmap(24, 100)
    pmp = QPainter(pm)
    pmp.setBrush(QBrush(grBtoY))
    pmp.setPen(Qt.NoPen)
    pmp.drawRect(0, 0, 24, 100)
    pmp.end()

    gradientBtoYPB = QPushButton(widget)
    gradientBtoYPB.setIcon(QIcon(pm))
    gradientBtoYPB.setIconSize(QSize(24, 100))

    grGtoR = QLinearGradient(0, 0, 1, 100)
    grGtoR.setColorAt(1.0, Qt.darkGreen)
    grGtoR.setColorAt(0.5, Qt.yellow)
    grGtoR.setColorAt(0.2, Qt.red)
    grGtoR.setColorAt(0.0, Qt.darkRed)
    pmp.begin(pm)
    pmp.setBrush(QBrush(grGtoR))
    pmp.drawRect(0, 0, 24, 100)
    pmp.end()

    gradientGtoRPB = QPushButton(widget)
    gradientGtoRPB.setIcon(QIcon(pm))
    gradientGtoRPB.setIconSize(QSize(24, 100))

    colorHBox = QHBoxLayout()
    colorHBox.addWidget(gradientBtoYPB)
    colorHBox.addWidget(gradientGtoRPB)
    colorGroupBox.setLayout(colorHBox)

    vLayout.addWidget(modelGroupBox)
    vLayout.addWidget(selectionGroupBox)
    vLayout.addWidget(QLabel("Column range"))
    vLayout.addWidget(axisMinSliderX)
    vLayout.addWidget(axisMaxSliderX)
    vLayout.addWidget(QLabel("Row range"))
    vLayout.addWidget(axisMinSliderZ)
    vLayout.addWidget(axisMaxSliderZ)
    vLayout.addWidget(QLabel("Theme"))
    vLayout.addWidget(themeList)
    vLayout.addWidget(colorGroupBox)

    widget.show()

    modifier = SurfaceGraph(graph)

    heightMapModelRB.toggled.connect(modifier.enableHeightMapModel)
    sqrtSinModelRB.toggled.connect(modifier.enableSqrtSinModel)
    modeNoneRB.toggled.connect(modifier.toggleModeNone)
    modeItemRB.toggled.connect(modifier.toggleModeItem)
    modeSliceRowRB.toggled.connect(modifier.toggleModeSliceRow)
    modeSliceColumnRB.toggled.connect(modifier.toggleModeSliceColumn)
    axisMinSliderX.valueChanged.connect(modifier.adjustXMin)
    axisMaxSliderX.valueChanged.connect(modifier.adjustXMax)
    axisMinSliderZ.valueChanged.connect(modifier.adjustZMin)
    axisMaxSliderZ.valueChanged.connect(modifier.adjustZMax)
    themeList.currentIndexChanged[int].connect(modifier.changeTheme)
    gradientBtoYPB.pressed.connect(modifier.setBlackToYellowGradient)
    gradientGtoRPB.pressed.connect(modifier.setGreenToRedGradient)

    modifier.setAxisMinSliderX(axisMinSliderX)
    modifier.setAxisMaxSliderX(axisMaxSliderX)
    modifier.setAxisMinSliderZ(axisMinSliderZ)
    modifier.setAxisMaxSliderZ(axisMaxSliderZ)

    sqrtSinModelRB.setChecked(True)
    modeItemRB.setChecked(True)
    themeList.setCurrentIndex(2)

    sys.exit(app.exec())
import math

from PySide6.QtCore import QObject, Qt, Slot
from PySide6.QtDataVisualization import (Q3DTheme, QAbstract3DGraph,
                                         QHeightMapSurfaceDataProxy,
                                         QSurface3DSeries, QSurfaceDataItem,
                                         QSurfaceDataProxy, QValue3DAxis)
from PySide6.QtGui import QImage, QLinearGradient, QVector3D
from PySide6.QtWidgets import QSlider

sampleCountX = 50
sampleCountZ = 50
heightMapGridStepX = 6
heightMapGridStepZ = 6
sampleMin = -8.0
sampleMax = 8.0


class SurfaceGraph(QObject):
    def __init__(self, surface, parent=None):
        QObject.__init__(self, parent)

        self.m_graph = surface
        self.m_graph.setAxisX(QValue3DAxis())
        self.m_graph.setAxisY(QValue3DAxis())
        self.m_graph.setAxisZ(QValue3DAxis())

        self.m_sqrtSinProxy = QSurfaceDataProxy()
        self.m_sqrtSinSeries = QSurface3DSeries(self.m_sqrtSinProxy)
        self.fillSqrtSinProxy()

        heightMapImage = QImage("mountain.png")
        self.m_heightMapProxy = QHeightMapSurfaceDataProxy(heightMapImage)
        self.m_heightMapSeries = QSurface3DSeries(self.m_heightMapProxy)
        self.m_heightMapSeries.setItemLabelFormat("(@xLabel, @zLabel): @yLabel")
        self.m_heightMapProxy.setValueRanges(34.0, 40.0, 18.0, 24.0)

        self.m_heightMapWidth = heightMapImage.width()
        self.m_heightMapHeight = heightMapImage.height()

        self.m_axisMinSliderX = QSlider()
        self.m_axisMaxSliderX = QSlider()
        self.m_axisMinSliderZ = QSlider()
        self.m_axisMaxSliderZ = QSlider()
        self.m_rangeMinX = 0.0
        self.m_rangeMinZ = 0.0
        self.m_stepX = 0.0
        self.m_stepZ = 0.0

    def fillSqrtSinProxy(self):
        stepX = (sampleMax - sampleMin) / float(sampleCountX - 1)
        stepZ = (sampleMax - sampleMin) / float(sampleCountZ - 1)

        dataArray = []
        for i in range(sampleCountZ):
            newRow = []
            # Keep values within range bounds, since just adding step can cause
            # minor drift due to the rounding errors.
            z = min(sampleMax, (i * stepZ + sampleMin))
            for j in range(sampleCountX):
                x = min(sampleMax, (j * stepX + sampleMin))
                R = math.sqrt(z * z + x * x) + 0.01
                y = (math.sin(R) / R + 0.24) * 1.61
                newRow.append(QSurfaceDataItem(QVector3D(x, y, z)))
            dataArray.append(newRow)

        self.m_sqrtSinProxy.resetArray(dataArray)

    def enableSqrtSinModel(self, enable):
        if enable:
            self.m_sqrtSinSeries.setDrawMode(QSurface3DSeries.DrawSurfaceAndWireframe)
            self.m_sqrtSinSeries.setFlatShadingEnabled(True)

            self.m_graph.axisX().setLabelFormat("%.2f")
            self.m_graph.axisZ().setLabelFormat("%.2f")
            self.m_graph.axisX().setRange(sampleMin, sampleMax)
            self.m_graph.axisY().setRange(0.0, 2.0)
            self.m_graph.axisZ().setRange(sampleMin, sampleMax)
            self.m_graph.axisX().setLabelAutoRotation(30)
            self.m_graph.axisY().setLabelAutoRotation(90)
            self.m_graph.axisZ().setLabelAutoRotation(30)

            self.m_graph.removeSeries(self.m_heightMapSeries)
            self.m_graph.addSeries(self.m_sqrtSinSeries)

            # Reset range sliders for Sqrt&Sin
            self.m_rangeMinX = sampleMin
            self.m_rangeMinZ = sampleMin
            self.m_stepX = (sampleMax - sampleMin) / float(sampleCountX - 1)
            self.m_stepZ = (sampleMax - sampleMin) / float(sampleCountZ - 1)
            self.m_axisMinSliderX.setMaximum(sampleCountX - 2)
            self.m_axisMinSliderX.setValue(0)
            self.m_axisMaxSliderX.setMaximum(sampleCountX - 1)
            self.m_axisMaxSliderX.setValue(sampleCountX - 1)
            self.m_axisMinSliderZ.setMaximum(sampleCountZ - 2)
            self.m_axisMinSliderZ.setValue(0)
            self.m_axisMaxSliderZ.setMaximum(sampleCountZ - 1)
            self.m_axisMaxSliderZ.setValue(sampleCountZ - 1)

    def enableHeightMapModel(self, enable):
        if enable:
            self.m_heightMapSeries.setDrawMode(QSurface3DSeries.DrawSurface)
            self.m_heightMapSeries.setFlatShadingEnabled(False)

            self.m_graph.axisX().setLabelFormat("%.1f N")
            self.m_graph.axisZ().setLabelFormat("%.1f E")
            self.m_graph.axisX().setRange(34.0, 40.0)
            self.m_graph.axisY().setAutoAdjustRange(True)
            self.m_graph.axisZ().setRange(18.0, 24.0)

            self.m_graph.axisX().setTitle("Latitude")
            self.m_graph.axisY().setTitle("Height")
            self.m_graph.axisZ().setTitle("Longitude")

            self.m_graph.removeSeries(self.m_sqrtSinSeries)
            self.m_graph.addSeries(self.m_heightMapSeries)

            # Reset range sliders for height map
            mapGridCountX = self.m_heightMapWidth / heightMapGridStepX
            mapGridCountZ = self.m_heightMapHeight / heightMapGridStepZ
            self.m_rangeMinX = 34.0
            self.m_rangeMinZ = 18.0
            self.m_stepX = 6.0 / float(mapGridCountX - 1)
            self.m_stepZ = 6.0 / float(mapGridCountZ - 1)
            self.m_axisMinSliderX.setMaximum(mapGridCountX - 2)
            self.m_axisMinSliderX.setValue(0)
            self.m_axisMaxSliderX.setMaximum(mapGridCountX - 1)
            self.m_axisMaxSliderX.setValue(mapGridCountX - 1)
            self.m_axisMinSliderZ.setMaximum(mapGridCountZ - 2)
            self.m_axisMinSliderZ.setValue(0)
            self.m_axisMaxSliderZ.setMaximum(mapGridCountZ - 1)
            self.m_axisMaxSliderZ.setValue(mapGridCountZ - 1)

    def adjustXMin(self, minimum):
        minX = self.m_stepX * float(minimum) + self.m_rangeMinX

        maximum = self.m_axisMaxSliderX.value()
        if minimum >= maximum:
            maximum = minimum + 1
            self.m_axisMaxSliderX.setValue(maximum)
        maxX = self.m_stepX * maximum + self.m_rangeMinX

        self.setAxisXRange(minX, maxX)

    def adjustXMax(self, maximum):
        maxX = self.m_stepX * float(maximum) + self.m_rangeMinX

        minimum = self.m_axisMinSliderX.value()
        if maximum <= minimum:
            minimum = maximum - 1
            self.m_axisMinSliderX.setValue(minimum)
        minX = self.m_stepX * minimum + self.m_rangeMinX

        self.setAxisXRange(minX, maxX)

    def adjustZMin(self, minimum):
        minZ = self.m_stepZ * float(minimum) + self.m_rangeMinZ

        maximum = self.m_axisMaxSliderZ.value()
        if minimum >= maximum:
            maximum = minimum + 1
            self.m_axisMaxSliderZ.setValue(maximum)
        maxZ = self.m_stepZ * maximum + self.m_rangeMinZ

        self.setAxisZRange(minZ, maxZ)

    def adjustZMax(self, maximum):
        maxX = self.m_stepZ * float(maximum) + self.m_rangeMinZ

        minimum = self.m_axisMinSliderZ.value()
        if maximum <= minimum:
            minimum = maximum - 1
            self.m_axisMinSliderZ.setValue(minimum)
        minX = self.m_stepZ * minimum + self.m_rangeMinZ

        self.setAxisZRange(minX, maxX)

    def setAxisXRange(self, minimum, maximum):
        self.m_graph.axisX().setRange(minimum, maximum)

    def setAxisZRange(self, minimum, maximum):
        self.m_graph.axisZ().setRange(minimum, maximum)

    @Slot()
    def changeTheme(self, theme):
        self.m_graph.activeTheme().setType(Q3DTheme.Theme(theme))

    def setBlackToYellowGradient(self):
        gr = QLinearGradient()
        gr.setColorAt(0.0, Qt.black)
        gr.setColorAt(0.33, Qt.blue)
        gr.setColorAt(0.67, Qt.red)
        gr.setColorAt(1.0, Qt.yellow)

        self.m_graph.seriesList()[0].setBaseGradient(gr)
        self.m_graph.seriesList()[0].setColorStyle(Q3DTheme.ColorStyleRangeGradient)

    def setGreenToRedGradient(self):
        gr = QLinearGradient()
        gr.setColorAt(0.0, Qt.darkGreen)
        gr.setColorAt(0.5, Qt.yellow)
        gr.setColorAt(0.8, Qt.red)
        gr.setColorAt(1.0, Qt.darkRed)

        series = self.m_graph.seriesList()[0]
        series.setBaseGradient(gr)
        series.setColorStyle(Q3DTheme.ColorStyleRangeGradient)

    def toggleModeNone(self):
        self.m_graph.setSelectionMode(QAbstract3DGraph.SelectionNone)

    def toggleModeItem(self):
        self.m_graph.setSelectionMode(QAbstract3DGraph.SelectionItem)

    def toggleModeSliceRow(self):
        self.m_graph.setSelectionMode(
            QAbstract3DGraph.SelectionItemAndRow | QAbstract3DGraph.SelectionSlice
        )

    def toggleModeSliceColumn(self):
        self.m_graph.setSelectionMode(
            QAbstract3DGraph.SelectionItemAndColumn | QAbstract3DGraph.SelectionSlice
        )

    def setAxisMinSliderX(self, slider):
        self.m_axisMinSliderX = slider

    def setAxisMaxSliderX(self, slider):
        self.m_axisMaxSliderX = slider

    def setAxisMinSliderZ(self, slider):
        self.m_axisMinSliderZ = slider

    def setAxisMaxSliderZ(self, slider):
        self.m_axisMaxSliderZ = slider
© 2022 The Qt Company Ltd. Documentation contributions included herein are the copyrights of their respective owners. The documentation provided herein is licensed under the terms of the GNU Free Documentation License version 1.3 as published by the Free Software Foundation. Qt and respective logos are trademarks of The Qt Company Ltd. in Finland and/or other countries worldwide. All other trademarks are property of their respective owners.