
StackedBarChart Drilldown Example
The example shows how to implement drilldown using a stacked barchart.
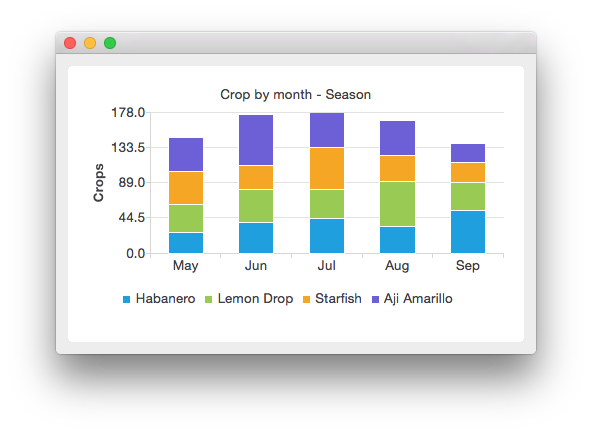
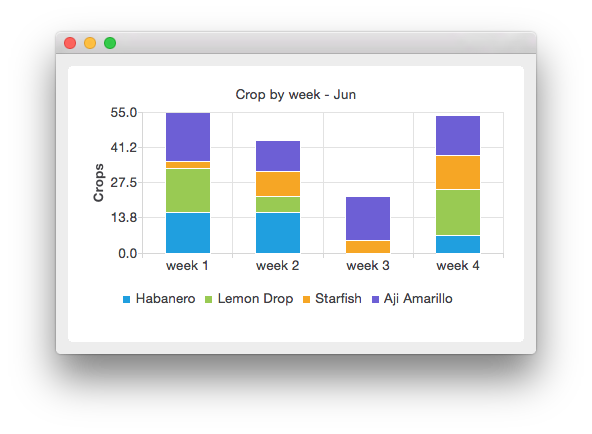
In the drilldown example we create a stacked bar chart, which shows the harvest of various chili peppers during season. In season view the harvest is grouped by month. To drill down to weekly view, right-click the selected month. On weekly view, the harvest of the month clicked is shown by week.
The season view looks like this:
Clicking on a month shows that month’s harvest:
Running the Example
To run the example from Qt Creator , open the Welcome mode and select the example from Examples. For more information, visit Building and Running an Example.
Implementing Drilldown
First we define a drilldown series class, which adds categories to the stacked bar series and mapping for categories to other drilldown series. The purpose of the drilldown series is to contain knowledge of the drilldown structure. The mapDrilldownSeries function maps the category to a given series. We can request the mapping for a category with the drilldownSeries(int category) function.
class DrilldownBarSeries(QStackedBarSeries):

    Q_OBJECT
# public
    DrilldownBarSeries(QStringList categories, int maxValue, QObject parent = 0)
    def mapDrilldownSeries(index, drilldownSeries):
    drilldownSeries = DrilldownBarSeries(int index)
    categories = QStringList()
    maxValue = int()
# private
DrilldownBarSeries = QMap<int,()
    m_categories = QStringList()
    m_maxValue = int()
Next we define our own drilldown chart, which implements the handler for the mouse click. All QBarSeries derived classes send out the clicked( QBarSet *, int) signal when a series is clicked with the mouse. The parameter QBarSet contains the pointer to the clicked bar set and parameter int contains the index of the clicked category.
class DrilldownChart(QChart):

    Q_OBJECT
# public
    def DrilldownChart(None,{}):
    def changeSeries(series):
Q_SLOTS: = public()
    def handleClicked(index, barset):
# private
    m_currentSeries = DrilldownBarSeries()
    m_axisX = QBarCategoryAxis()
    m_axisY = QValueAxis()
Now we have our drilldown classes and we can start using them. First create the chart.
drilldownChart = DrilldownChart()
drilldownChart.setAnimationOptions(QChart.SeriesAnimations)
We define the categories from which the drilldown series will be constructed.
# Define categories
months = {
    "May", "Jun", "Jul", "Aug", "Sep"

weeks = {
    "week 1", "week 2", "week 3", "week 4"

plants = {
    "Habanero", "Lemon Drop", "Starfish", "Aji Amarillo"
To create the drilldown structure, we first create our top level series, which we call seasonSeries. For each month in seasonSeries we create a drilldown series called weeklySeries which contains more detailed data for that month. In weeklySeries, we use the drilldown handler to bring us back to seasonSeries. To do so we add mapping to the series. The seasonSeries is mapped to weeklySeries for each month. Every weeklySeries is mapped back to the seasonSeries. To make mapping work, we connect the clicked signals from our series to the drilldownChart.
# Create drilldown structure
seasonSeries = DrilldownBarSeries(months, 320, drilldownChart)
seasonSeries.setName("Crop by month - Season")
# Each month in season series has drilldown series for weekly data
for month in range(0, months.count()):
    # Create drilldown series for every week
    weeklySeries = DrilldownBarSeries(weeks, 80, drilldownChart)
    seasonSeries.mapDrilldownSeries(month, weeklySeries)
    # Drilling down from weekly data brings us back to season data.
    for week in range(0, weeks.count()):
        weeklySeries.mapDrilldownSeries(week, seasonSeries)
        weeklySeries.setName(QString("Crop by week - " + months.at(month)))

    # Use clicked signal to implement drilldown
    QObject.connect(weeklySeries, DrilldownBarSeries.clicked,
                     drilldownChart, DrilldownChart::handleClicked)

# Enable drilldown from season series using clicked signal
QObject.connect(seasonSeries, DrilldownBarSeries.clicked,
                 drilldownChart, DrilldownChart::handleClicked)
When we have our drilldown structure ready, we can add the data to it. Here we generate a random crop for each plant in each week. The monthly crop is calculated from weekly crops and is set as value to the monthly series.
# Fill monthly and weekly series with data
for plant in plants:
    monthlyCrop = QBarSet(plant)
    for month in range(0, months.count()):
        weeklyCrop = QBarSet(plant)
        for week in range(0, weeks.count()):
            weeklyCrop << QRandomGenerator.global().bounded(20)
        # Get the drilldown series from season series and add crop to it.
        seasonSeries.drilldownSeries(month).append(weeklyCrop)
        monthlyCrop << weeklyCrop.sum()

    seasonSeries.append(monthlyCrop)
Here we set the chart to show the top level series initially.
# Show season series in initial view
drilldownChart.changeSeries(seasonSeries)
drilldownChart.setTitle(seasonSeries.name())
© 2022 The Qt Company Ltd. Documentation contributions included herein are the copyrights of their respective owners. The documentation provided herein is licensed under the terms of the GNU Free Documentation License version 1.3 as published by the Free Software Foundation. Qt and respective logos are trademarks of The Qt Company Ltd. in Finland and/or other countries worldwide. All other trademarks are property of their respective owners.