
Qt Quick 2 Axis Formatter Example
Example of a hybrid C++ and QML application demonstrating different axis formatters.
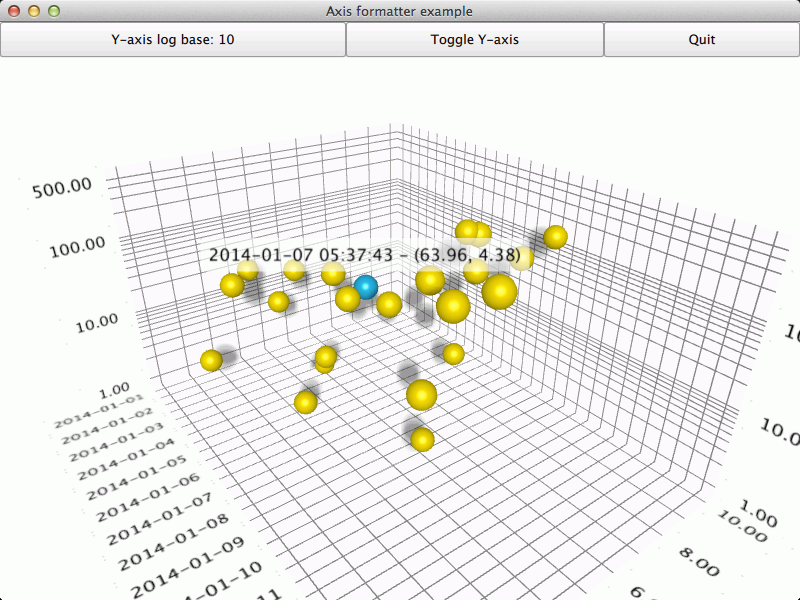
The Qt Quick axis formatter example shows how to use predefined axis formatters and how to create a custom one.
The interesting thing about this example is axis formatters, so we’ll concentrate on that and skip explaining the basic functionality - for more detailed QML example documentation, see Qt Quick 2 Scatter Example .
Running the Example
To run the example from Qt Creator , open the Welcome mode and select the example from Examples. For more information, visit Building and Running an Example.
Custom Axis Formatter
Customizing axis formatters requires subclassing the QValue3DAxisFormatter , which cannot be done in QML code alone. In this example we want an axis that interprets the float values as a timestamp and shows the date in the axis labels. To achieve this, we introduce a new class called CustomFormatter, which subclasses the QValue3DAxisFormatter :
class CustomFormatter(QValue3DAxisFormatter): ...
Since float values of a QScatter3DSeries cannot be directly cast into QDateTime values due to difference in data width, we need some sort of mapping between the two. We chose to do the mapping by specifying an origin date for the formatter and interpreting the float values from the QScatter3DSeries as date offsets to that origin value. The origin date is given as a property:
Q_PROPERTY(QDate originDate READ originDate WRITE setOriginDate NOTIFY originDateChanged)
The mapping from value to QDateTime is done using valueToDateTime() method:
def valueToDateTime(self, qreal value):

    return m_originDate.startOfDay().addMSecs(qint64(oneDayMs * value))
To function as an axis formatter, our CustomFormatter needs to reimplement some virtual methods:
QValue3DAxisFormatter = virtual()
void = virtual(QValue3DAxisFormatter copy)
void = virtual()
QString = virtual(qreal value, QString format)
The first two are simple, we just create a new instance of CustomFormatter and copy the necessary data over to it. These two methods are used to create and update a cache of formatter for rendering purposes. It is important to remember to call the superclass implementation of populateCopy():
CustomFormatter::createNewInstance = QValue3DAxisFormatter()

    def CustomFormatter():

def populateCopy(self, copy):

    QValue3DAxisFormatter.populateCopy(copy)
    customFormatter = CustomFormatter (copy)
    customFormatter.m_originDate = m_originDate
    customFormatter.m_selectionFormat = m_selectionFormat
Bulk of the work done by CustomFormatter is done in the recalculate() method, where our formatter calculates the grid, subgrid, and label positions, as well as formats the label strings. In our custom formatter we ignore the segment count of the axis and draw a grid line always at midnight. Subsegment count and label positioning is handled normally:
def recalculate(self):

    # We want our axis to always have gridlines at date breaks
    # Convert range into QDateTimes
    minTime = valueToDateTime(qreal(axis().min()))
    maxTime = valueToDateTime(qreal(axis().max()))
    # Find out the grid counts
    midnight = QTime(0, 0)
    minFullDate = QDateTime(minTime.date(), midnight)
    gridCount = 0
    if (minFullDate != minTime)
        minFullDate = minFullDate.addDays(1)
    maxFullDate = QDateTime(maxTime.date(), midnight)
    gridCount += minFullDate.daysTo(maxFullDate) + 1
    subGridCount = axis().subSegmentCount() - 1
    # Reserve space for position arrays and label strings
    gridPositions().resize(gridCount)
    subGridPositions().resize((gridCount + 1) * subGridCount)
    labelPositions().resize(gridCount)
    labelStrings().reserve(gridCount)
    # Calculate positions and format labels
    startMs = minTime.toMSecsSinceEpoch()
    endMs = maxTime.toMSecsSinceEpoch()
    dateNormalizer = endMs - startMs
    firstLineOffset = (minFullDate.toMSecsSinceEpoch() - startMs) / dateNormalizer
    segmentStep = oneDayMs / dateNormalizer
    subSegmentStep = 0
    if (subGridCount > 0)
        subSegmentStep = segmentStep / qreal(subGridCount + 1)
    for i in range(0, gridCount):
        gridValue = firstLineOffset + (segmentStep * qreal(i))
        gridPositions()[i] = float(gridValue)
        labelPositions()[i] = float(gridValue)
        labelStrings() << minFullDate.addDays(i).toString(axis().labelFormat())

    for i in range(0, gridCount + 1):
        if (subGridPositions().size()) {
            for j in range(0, subGridCount):
                position = float()
                if (i)
                    position = gridPositions().at(i - 1) + subSegmentStep * (j + 1)
else:
                    position = gridPositions().at(0) - segmentStep + subSegmentStep * (j + 1)
                if (position > 1.0f or position < 0.0f)
                    position = gridPositions().at(0)
                subGridPositions()[i * subGridCount + j] = position
The axis labels are formatted to show only the date, but for selection label we want little more resolution for the timestamp, so we specify another property for our custom formatter to allow user to customize it:
Q_PROPERTY(QString selectionFormat READ selectionFormat WRITE setSelectionFormat NOTIFY selectionFormatChanged)
This selection format property is used in the reimplemented stringToValue method, where we ignore the submitted format and substitute the custom selection format for it:
def stringForValue(self, qreal value, QString format):

    Q_UNUSED(format)
    def valueToDateTime(value).toString(m_selectionFormat):
To expose our new custom formatter to the QML, we must declare and register it:
Q_DECLARE_METATYPE(CustomFormatter *)        ...
qmlRegisterType<CustomFormatter>("CustomFormatter", 1, 0, "CustomFormatter")
QML
In the QML codes, we define a different axis for each dimension:
axisZ: valueAxis
axisY: logAxis
axisX: dateAxis
Z-axis is just a regular ValueAxis3D :
ValueAxis3D {
    id: valueAxis
    segmentCount: 5
    subSegmentCount: 2
    labelFormat: "%.2f"
    min: 0
    max: 10
}
For the Y-axis we define a logarithmic axis. ValueAxis3D can be made to show logarithmic scale by specifying LogValueAxis3DFormatter for formatter property of the axis:
ValueAxis3D {
    id: logAxis
    formatter: LogValueAxis3DFormatter {
        id: logAxisFormatter
        base: 10
        autoSubGrid: true
        showEdgeLabels: true
    }
    labelFormat: "%.2f"
}
And finally, for the X-axis we use our new CustomFormatter:
ValueAxis3D {
    id: dateAxis
    formatter: CustomFormatter {
        originDate:  "2014-01-01"
        selectionFormat: "yyyy-MM-dd HH:mm:ss"
    }
    subSegmentCount: 2
    labelFormat: "yyyy-MM-dd"
    min: 0
    max: 14
}
Rest of the application consists of fairly self-explanatory logic for modifying the axes and showing the graph.
© 2022 The Qt Company Ltd. Documentation contributions included herein are the copyrights of their respective owners. The documentation provided herein is licensed under the terms of the GNU Free Documentation License version 1.3 as published by the Free Software Foundation. Qt and respective logos are trademarks of The Qt Company Ltd. in Finland and/or other countries worldwide. All other trademarks are property of their respective owners.