- class QAbstractBarSeries#
The
QAbstractBarSeriesclass is an abstract parent class for all bar series classes. More…Inherited by:
QBarSeries,QStackedBarSeries,QPercentBarSeries,QHorizontalStackedBarSeries,QHorizontalPercentBarSeries,QHorizontalBarSeriesSynopsis#
Properties#
barWidthᅟ- Width of the bars of the seriescountᅟ- Number of bar sets in a bar serieslabelsAngleᅟ- Angle of the value labels in degreeslabelsFormatᅟ- Format used for showing labels in a bar serieslabelsPositionᅟ- Position of value labelslabelsPrecisionᅟ- Maximum amount of significant digits shown in value labelslabelsVisibleᅟ- Visibility of the labels in a bar series
Methods#
def
barWidth()def
clear()def
count()def
labelsAngle()def
labelsFormat()def
setBarWidth()def
setLabelsAngle()
Signals#
Note
This documentation may contain snippets that were automatically translated from C++ to Python. We always welcome contributions to the snippet translation. If you see an issue with the translation, you can also let us know by creating a ticket on https:/bugreports.qt.io/projects/PYSIDE
Detailed Description#
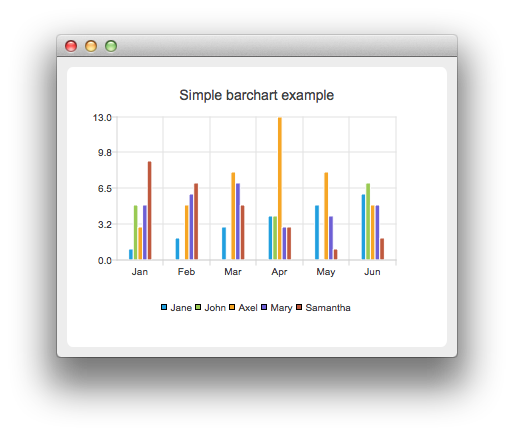
In bar charts, bars are defined as bar sets that contain one data value for each category. The position of a bar is specified by the category and its height by the data value. Bar series that contain multiple bar sets group together bars that belong to the same category. The way the bars are displayed is determined by the subclass of this class chosen to create the bar chart.
If a
QValueAxisis used instead ofQBarCategoryAxisfor the main bar axis, the bars are grouped around the index value of the category.See the Charts with Widgets Gallery to learn how to use the
QBarSeriesclass to create a simple bar chart.- class LabelsPosition#
This enum value describes the position of the data value labels:
Constant
Description
QAbstractBarSeries.LabelsCenter
Label is located in the center of the bar.
QAbstractBarSeries.LabelsInsideEnd
Label is located inside the bar at the top.
QAbstractBarSeries.LabelsInsideBase
Label is located inside the bar at the bottom.
QAbstractBarSeries.LabelsOutsideEnd
Label is located outside the bar at the top.
Note
Properties can be used directly when
from __feature__ import true_propertyis used or via accessor functions otherwise.- property barWidthᅟ: float#
This property holds The width of the bars of the series..
The unit of width is the unit of the x-axis. The minimum width for bars is zero, and negative values are treated as zero. Setting the width to zero means that the width of the bar on the screen is one pixel regardless of the scale of the x-axis. Bars wider than zero are scaled using the x-axis scale.
Note
When used with
QBarSeries, this value specifies the width of a group of bars instead of that of a single bar.See also
- Access functions:
- property countᅟ: int#
This property holds The number of bar sets in a bar series..
- Access functions:
Signal
countChanged()
- property labelsAngleᅟ: float#
This property holds The angle of the value labels in degrees..
- Access functions:
- property labelsFormatᅟ: str#
This property holds The format used for showing labels in a bar series..
QAbstractBarSeriessupports the following format tag:@value
The value of the bar
For example, the following usage of the format tags would produce labels that show the value followed by the unit (u):
series->setLabelsFormat("@value u");
By default, the labels show the value of the bar. For the percent bar series, % is added after the value. The labels are shown on the plot area, if the bars are close to each other, the labels may overlap.
See also
labelsVisiblelabelsPositionlabelsPrecision- Access functions:
- property labelsPositionᅟ: QAbstractBarSeries.LabelsPosition#
This property holds The position of value labels..
See also
labelsVisiblelabelsFormatAccess functions:
- property labelsPrecisionᅟ: int#
This property holds The maximum amount of significant digits shown in value labels..
Default value is 6.
- Access functions:
- property labelsVisibleᅟ: bool#
This property holds The visibility of the labels in a bar series..
- Access functions:
- barWidth()#
- Return type:
float
Returns the width of the bars of the series.
See also
Getter of property
barWidthᅟ.- clear()#
Removes all bar sets from the series and permanently deletes them.
- count()#
- Return type:
int
Returns the number of bar sets in a bar series.
Getter of property
countᅟ.- countChanged()#
This signal is emitted when the number of bar sets is changed, for example by
append()orremove().Notification signal of property
countᅟ.- isLabelsVisible()#
- Return type:
bool
Returns the visibility of labels.
Getter of property
labelsVisibleᅟ.- labelsAngle()#
- Return type:
float
See also
Getter of property
labelsAngleᅟ.- labelsAngleChanged(angle)#
- Parameters:
angle – float
This signal is emitted when the
angleof the value labels changes.Notification signal of property
labelsAngleᅟ.- labelsFormat()#
- Return type:
str
See also
Getter of property
labelsFormatᅟ.- labelsFormatChanged(format)#
- Parameters:
format – str
This signal is emitted when the
formatof data value labels changes.Notification signal of property
labelsFormatᅟ.- labelsPrecision()#
- Return type:
int
See also
Getter of property
labelsPrecisionᅟ.- labelsPrecisionChanged(precision)#
- Parameters:
precision – int
This signal is emitted when the
precisionof the value labels changes.Notification signal of property
labelsPrecisionᅟ.- labelsVisibleChanged()#
This signal is emitted when the labels’ visibility changes.
See also
Notification signal of property
labelsVisibleᅟ.- setBarWidth(width)#
- Parameters:
width – float
Sets the width of the bars of the series to
width.See also
Setter of property
barWidthᅟ.- setLabelsAngle(angle)#
- Parameters:
angle – float
See also
Setter of property
labelsAngleᅟ.- setLabelsFormat(format)#
- Parameters:
format – str
See also
Setter of property
labelsFormatᅟ.- setLabelsPrecision(precision)#
- Parameters:
precision – int
See also
Setter of property
labelsPrecisionᅟ.- setLabelsVisible([visible=true])#
- Parameters:
visible – bool
Sets the visibility of labels in a bar series to
visible.See also
Setter of property
labelsVisibleᅟ.
Back to top