Debugging PySide with VSCode (Linux + Windows)
VSCode enables you to use more than one debugger in a single debugging session. This means that we can use Python PDB and GDB (or the MSVC debugger for Windows) in a single session. With VSCode you would be able to do the following:
See the call stacks for both Python and C++ together.
Put breakpoints in both the Python and the C++ code.
Step from Python to C++ code and vice versa.
For Windows, see Creating Debug Builds.
Let’s get started with setting up everything and debugging a Python process.
Setting the Python interpreter
In order to debug Python code, it is necessary to set the correct Python interpreter in VSCode - this will ensure that all Python integrations of VSCode use the same interpreter. However, this does not affect C++ debugging, and the Python executable path must be set for the corresponding launch target separately (see the section below).
To set the Python interpreter, open a Python file and click the corresponding option on the right side of the VSCode status bar, which should look similar to this:

Alternatively, open the VSCode command palette (F1 or Ctrl + Shift + P) and search for “Python: Select Interpreter”.
Creating Configurations in launch.json
Run -> Add Configuration -> Python -> Python File
This should create a launch.json file which looks like this:
{
    // Use IntelliSense to learn about possible attributes.
    // Hover to view descriptions of existing attributes.
    // For more information, visit: https://go.microsoft.com/fwlink/?linkid=830387
    "version": "0.2.0",
    "configurations": [
        {
            "name": "Python: Current File",
            "type": "python",
            "request": "launch",
            "program": "${file}",
            "console": "integratedTerminal"
        }
    ]
}
It should already consist of a configuration named “Python: Current File”, which allows us to debug the current open Python file.
Now, we need to add a configuration to attach the C++ debugger to the Python process that is already running in debug mode. If you have the C/C++ extension installed and the appropriate debugger for your system, VSCode should be able to automatically offer to add a configuration. On Linux, this is suggested with the name
“C/C++: (gdb) Attach”
and on Windows with the name
“C/C++: (Windows) Attach”
Your launch.json should now look like this on Linux:
{
    // Use IntelliSense to learn about possible attributes.
    // Hover to view descriptions of existing attributes.
    // For more information, visit: https://go.microsoft.com/fwlink/?linkid=830387
    "version": "0.2.0",
    "configurations": [
        {
            "name": "Python: Current File",
            "type": "python",
            "request": "launch",
            "program": "${file}",
            "console": "integratedTerminal"
        },
        {
            "name": "(gdb) Attach",
            "type": "cppdbg",
            "request": "attach",
            "program": "/path/to/python",
            "processId": "${command:pickProcess}",
            "MIMode": "gdb", "setupCommands": [
                {
                    "description": "Enable pretty-printing for gdb",
                    "text": "-enable-pretty-printing",
                    "ignoreFailures": true
                }
            ]
        }
    ]
}
And like this on Windows:
{
    // Use IntelliSense to learn about possible attributes.
    // Hover to view descriptions of existing attributes.
    // For more information, visit: https://go.microsoft.com/fwlink/?linkid=830387
    "version": "0.2.0",
    "configurations": [
        {
            "name": "Python: Current File",
            "type": "python",
            "request": "launch",
            "program": "${file}",
            "console": "integratedTerminal"
        },
        {
            "name": "(Windows) Attach",
            "type": "cppvsdbg",
            "request": "attach",
            "processId": "${command:pickProcess}",
        }
    ]
}
For Linux, also make sure that the value of “program” refers to your Python interpreter inside your virtual environment (for Windows this is not needed). We need the processId to attach the gdb debugger to the process. With “${command:pickProcess}”, we find the processId on the go, as we will see later.
Now, we are ready to debug.
Debug The Process
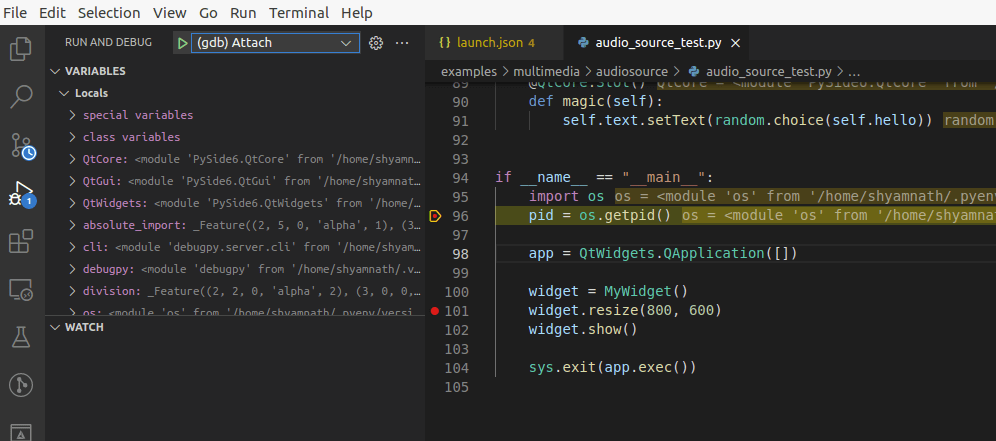
Set a breakpoint in the Python code.
Go to
Run And Debug(Ctrl + Shift + D) and run the “Python: Current File” by clicking the run symbol (green right-arrow). This will hit the breakpoint and will halt the Python debugger.Using the drop-down menu change from “Python: Current File” to “(gdb) Attach” or “(Windows) Attach”. Your setup should now look like this.
Run “(gdb) Attach” or “(Windows) Attach” and this should ask you for the processId of the Python process to which you want to attach the C++ debugger. VSCode also lets you search for the process by its name.
Tip
You can find the processId by running
ps aux | grep python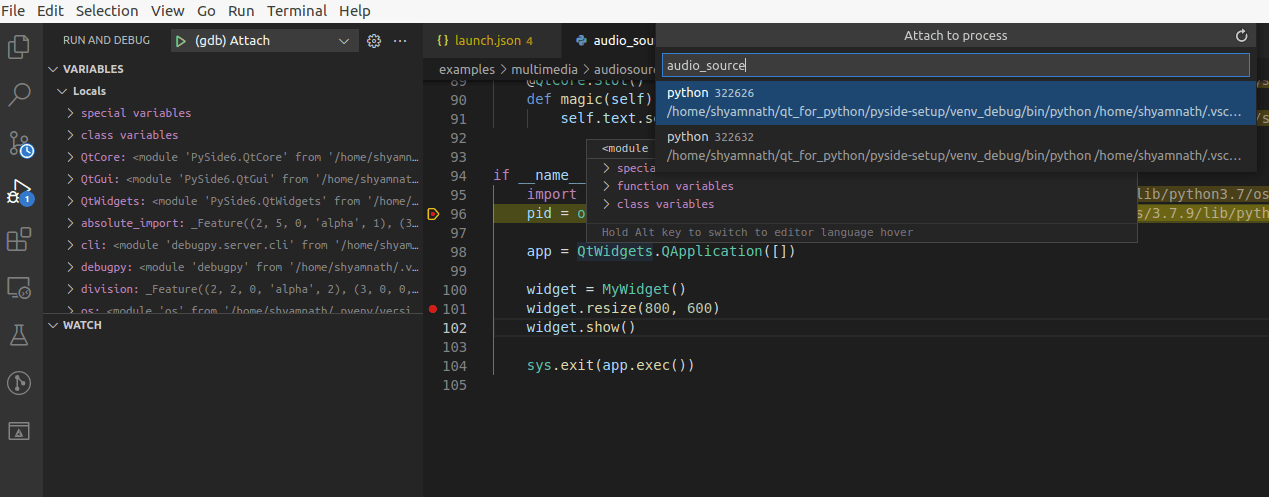
VSCode might now ask you for superuser permissions. In that case, type ‘y’ and enter your password.
Superuser access is required to attach to a process. Attaching as
superuser can potentially harm your computer. Do you want to continue?
[y/N]_
That is it. You should now be able to hit the breakpoints that you have set on the C++ counterparts.
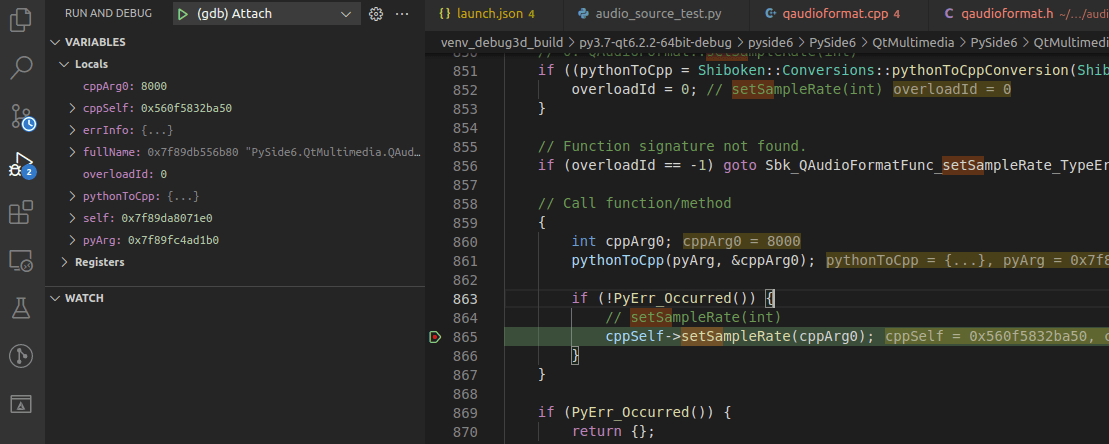
Breakpoint set on the shiboken wrapper class
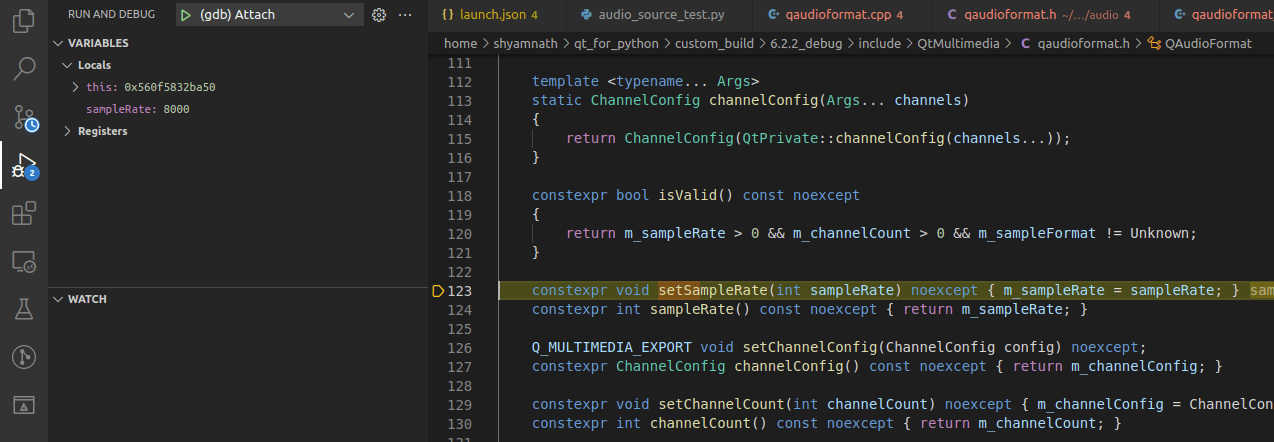
Breakpoint set on C++ implementation