
Neptune 3 UI - System Dialog
Neptune 3 UI has a system dialog where the user can see and monitor the performance of the system while running Neptune 3 UI. In order to pop the dialog up, user can tap on the Qt logo that is located at the bottom right corner of the UI.
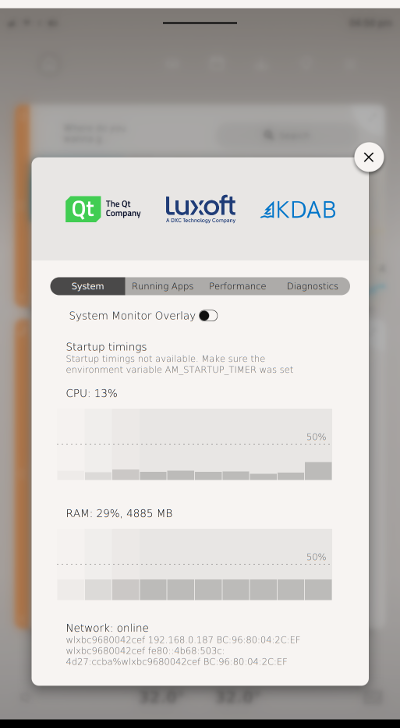
System Monitor
The first tab of the system dialog contains the following information:
- Startup Timings: provides the time spent from booting until the process starting point of the System UI and from the starting point of the System UI until the first frame to be drawn
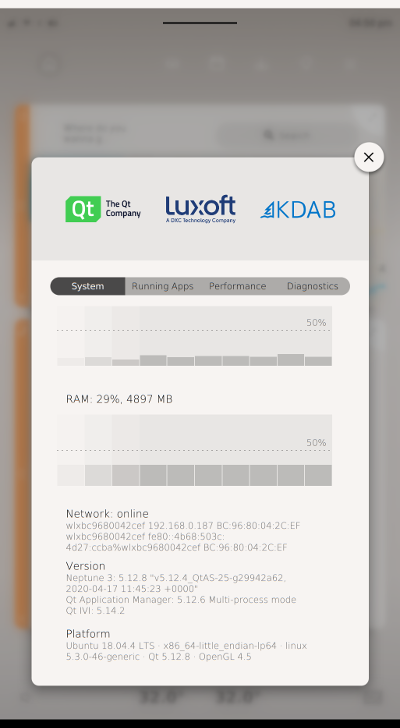
- CPU consumptions and memory consumptions
- Network (Internet Connection) Status
- Connected Network Devices with all their address information
- Version: shows which Neptune 3 UI, Application Manager and Qt IVI versions are being used
- Platform: shows which operating system, Qt version, and OpenGL are being used.
On top of the list, there is also a switch button that is used to show the system monitor overlay on top of the UI to show the performance monitor numbers while operating the UI.
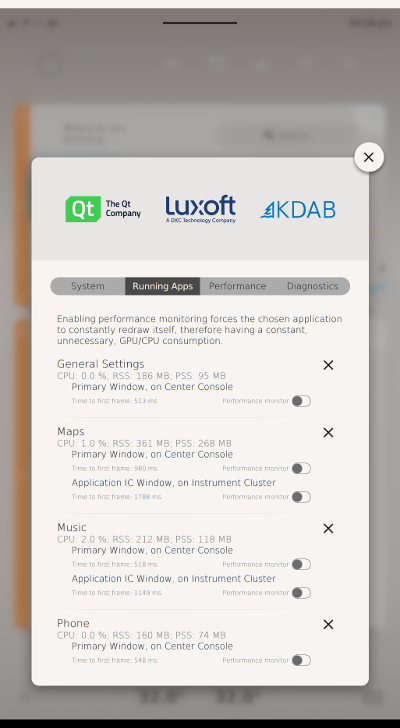
List of Running Applications
The second tab of the system dialog shows a list of current running applications in Neptune 3 UI. Each application item contains the following information:
- CPU and Memory consumptions
- Time spent until first frame of the application to be drawn
Each application item also has a switch button to enable the performance overlay on top of the application window. For an application that has two windows, ApplicationCCWindow and ApplicationICWindow, two switch buttons can be seen and selected depending on the need.
In order to kill the application, an X icon on the right side of the application item can be tapped. Once the application is killed, it will also be removed from the application list.
Note: Only removing the application widget in the home screen, does not mean that the application is killed, it could still be running in the background.
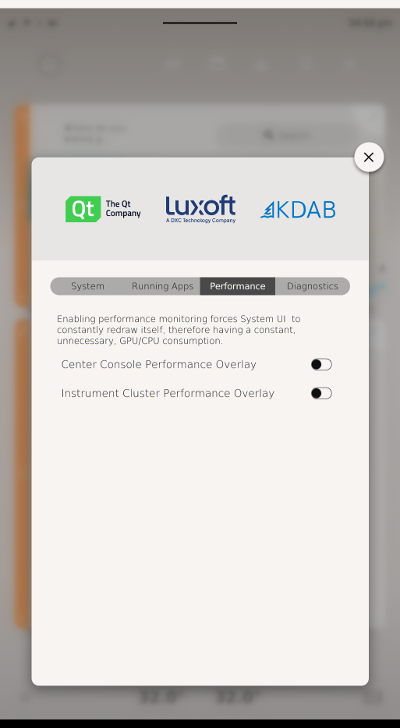
Performance Tab
The third tab of the system dialog contains two switch buttons to enable the performance overlay of the center console display and the instrument cluster. It forces the System UI to constantly re-draw itself to get the current GPU/CPU consumptions.
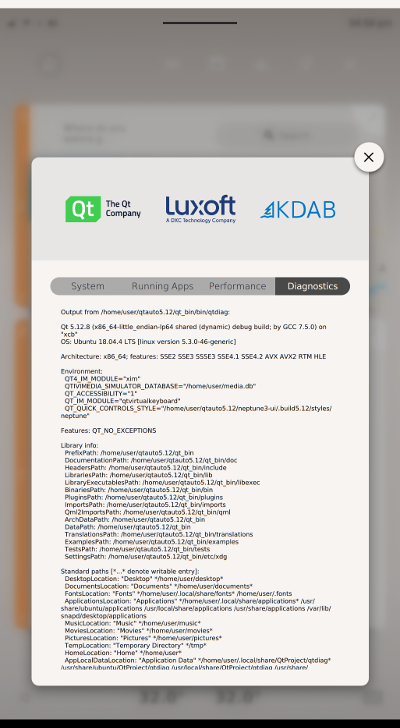
Diagnostics Tab
The last tab of the system dialog shows the output of the QtDiag diagnostic tool.
© 2018 Pelagicore AG. Documentation contributions included herein are the copyrights of their respective owners. The documentation provided herein is licensed under the terms of the GNU Free Documentation License version 1.3 as published by the Free Software Foundation. Qt and respective logos are trademarks of The Qt Company Ltd. in Finland and/or other countries worldwide. All other trademarks are property of their respective owners.