LineSeries QML Type
Presents data in line graphs. More...
| Import Statement: | import QtGraphs |
| In C++: | QLineSeries |
| Inherits: |
- List of all members, including inherited members
- LineSeries is part of Qt Graphs QML Types for 2D.
Properties
- capStyle : Qt::PenCapStyle
- dashOffset : real
(since 6.11) - dashPattern : list<real>
(since 6.11) - joinStyle : Qt::PenJoinStyle
(since 6.11) - lineStyle : QLineSeries::LineStyle
(since 6.11) - pointDelegate : Component
- strokeStyle : enumeration
(since 6.11) - width : real
Signals
- capStyleChanged()
- dashOffsetChanged(qreal newDashOffset)
(since 6.11) - dashPatternChanged(QList<qreal> newDashPattern)
(since 6.11) - joinStyleChanged(Qt::PenJoinStyle newJoinStyle)
(since 6.11) - lineStyleChanged(QLineSeries::LineStyle newLineStyle)
(since 6.11) - strokeStyleChanged(QLineSeries::StrokeStyle newStrokeStyle)
(since 6.11) - widthChanged()
Methods
- point dataPointCoordinatesAt(real x, real y)
Detailed Description
A line graph is used to show information as a series of data points connected by straight lines or steps.
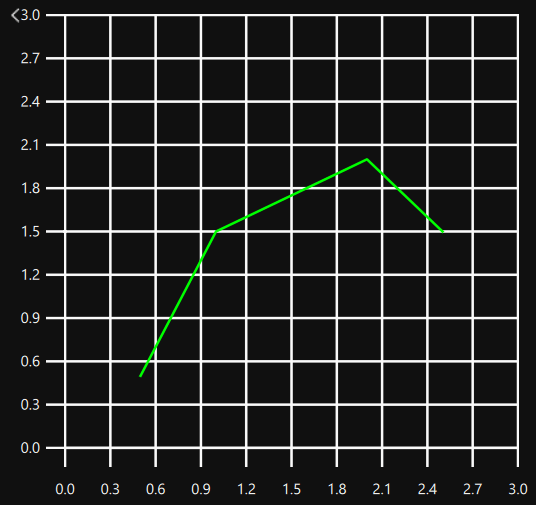
Series can contain gaps using NaN values as in :
import QtGraphs

GraphsView {
    axisX: ValueAxis {
        max: 5
    }
    axisY: ValueAxis {
        max: 5
    }

    LineSeries {
        color: "#00ff00"
        joinStyle: Qt.RoundJoin

        XYPoint {
            x: 0.5
            y: 0.5
        }

        XYPoint {
            x: 1.1
            y: NaN
        }

        XYPoint {
            x: 1.9
            y: 3.3
        }

        XYPoint {
            x: 2.1
            y: 2.1
        }

        XYPoint {
            x: 5
            y: 4.9
        }
    }
}
or
QLineSeries *series = new QLineSeries();
series->append(0, 2);
series->append(2, 4);
series->append(3, std::numeric_limits<qreal>::quiet_NaN());
series->append(4, 1);
series->append(5, 0);
series->setLineStyle(QLineSeries::LineStyle::StepCenter);
series->setColor(Qt::red);
which result in :
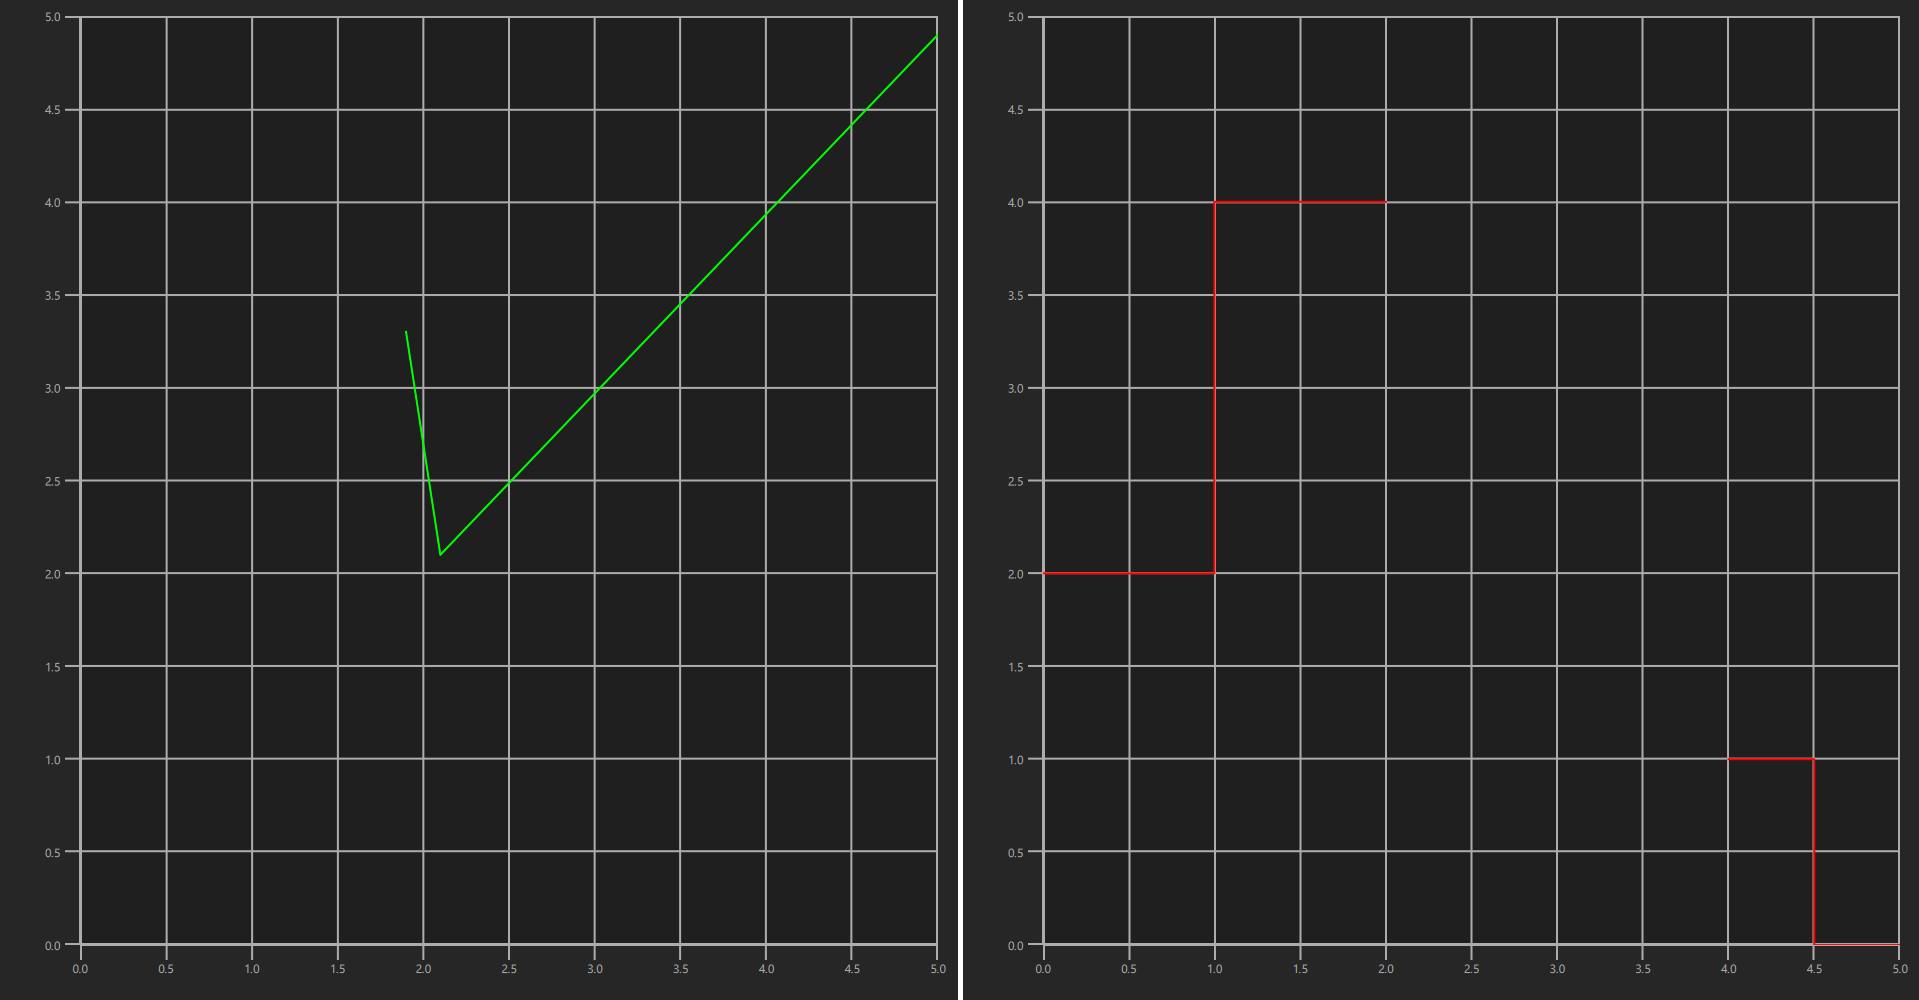
Note: As seen on the above example's first graph, alone points (like the first point of the series) won't be rendered as lines, unless there is a visible pointDelegate
LineSeries uses mostly the same API as ScatterSeries so see ScatterSeries documentation for further usage examples.
See also ScatterSeries.
Property Documentation
capStyle : Qt::PenCapStyle
Controls the cap style of the line. Set to one of Qt.FlatCap, Qt.SquareCap or Qt.RoundCap. By default the cap style is Qt.SquareCap. Invalid values are automatically set to the default value.
See also Qt::PenCapStyle.
dashOffset : real [since 6.11]
This property defines the starting point on the dash pattern, measured in units used to specify the dash pattern.
The default value is 0.
This property was introduced in Qt 6.11.
dashPattern : list<real> [since 6.11]
This property defines the dash pattern when strokeStyle is set to LineSeries::DashLine. The pattern must be specified as an even number of positive entries where the entries 1, 3, 5... are the dashes and 2, 4, 6... are the spaces. The pattern is specified in units of the line's width.
The default value is (4, 2), meaning a dash of 4 * width pixels followed by a space of 2 * width pixels.
This property was introduced in Qt 6.11.
joinStyle : Qt::PenJoinStyle [since 6.11]
Controls the join style of the line. Set to one of Qt.BevelJoin, Qt.MiterJoin or Qt.RoundJoin. By default the join style is Qt.BevelJoin. Invalid values are automatically set to the default value.
This property was introduced in Qt 6.11.
See also Qt::PenJoinStyle.
lineStyle : QLineSeries::LineStyle [since 6.11]
Controls the line style of the line. Set to one of LineSeries.Straight, LineSeries.StepLeft, LineSeries.StepRight or LineSeries.StepCenter. By default the line style is LineSeries.Straight. Invalid values are automatically set to the default value.
This property was introduced in Qt 6.11.
See also QLineSeries::LineStyle.
pointDelegate : Component
Marks the point with the given QML component.
pointDelegate: Image {
    source: "images/happy_box.png"
}
strokeStyle : enumeration [since 6.11]
| Constant | Description |
|---|---|
LineSeries.SolidLine | A plain line. |
LineSeries.DashLine | Dashes separated by a few pixels. |
This property was introduced in Qt 6.11.
width : real
The width of the line. By default, the width is 2.0. Widths lower than 0 are invalid and are automatically set to 0.
Signal Documentation
capStyleChanged()
This signal is emitted when the line series cap style changes.
Note: The corresponding handler is onCapStyleChanged.
[since 6.11] dashOffsetChanged(qreal newDashOffset)
This signal is emitted when the line series line dash offset changes. The newDashOffset parameter holds the new dash offset.
Note: The corresponding handler is onDashOffsetChanged.
This signal was introduced in Qt 6.11.
[since 6.11] dashPatternChanged(QList<qreal> newDashPattern)
This signal is emitted when the line series line dash pattern changes. The newDashPattern parameter holds the new dash pattern.
Note: The corresponding handler is onDashPatternChanged.
This signal was introduced in Qt 6.11.
[since 6.11] joinStyleChanged(Qt::PenJoinStyle newJoinStyle)
This signal is emitted when the line series cap style changes. The newJoinStyle parameter holds the new join style.
Note: The corresponding handler is onJoinStyleChanged.
This signal was introduced in Qt 6.11.
[since 6.11] lineStyleChanged(QLineSeries::LineStyle newLineStyle)
This signal is emitted when the line series line style changes. The newLineStyle parameter holds the new line style.
Note: The corresponding handler is onLineStyleChanged.
This signal was introduced in Qt 6.11.
[since 6.11] strokeStyleChanged(QLineSeries::StrokeStyle newStrokeStyle)
This signal is emitted when the line series stroke style changes. The newStrokeStyle parameter holds the new stroke style.
Note: The corresponding handler is onStrokeStyleChanged.
This signal was introduced in Qt 6.11.
widthChanged()
This signal is emitted when the line series width changes.
Note: The corresponding handler is onWidthChanged.
Method Documentation
point dataPointCoordinatesAt(real x, real y)
Returns x and y rendercoordinates converted into data point coordinates.
© 2026 The Qt Company Ltd. Documentation contributions included herein are the copyrights of their respective owners. The documentation provided herein is licensed under the terms of the GNU Free Documentation License version 1.3 as published by the Free Software Foundation. Qt and respective logos are trademarks of The Qt Company Ltd. in Finland and/or other countries worldwide. All other trademarks are property of their respective owners.
