Qt Data Visualization Overview
The Qt Data Visualization module provides a way to develop rapidly responding, complex, and dynamic 3D visualization for analytical demanding industries such as academic research and medical. Qt 3D Data Visualization provides 3D bars, scatter, and surface visualizations. Combining user interaction and real time 3D drawing visualizations enables creating user interfaces that use space effectively. Changing between 3D and 2D presentation enables truly utilizing the value of 3D in visualizing data.
The look and feel of the graphs can be customized by using the predefined themes or defining new ones. In addition, scenes can be customized by specifying settings for the camera, and individual items can be customized by using predefined or user-defined meshes.
Qt Data Visualization offers ready-made data proxies that can be used to visualize data from Qt item models and height maps. Each graph type has a basic proxy type, which accepts data in a format suitable for that visualization. For more information, see Qt Data Visualization Data Handling.
End users can interact with the data presented by graphs in several ways, including rotating graphs, zooming into and out of data, selecting items, and viewing 2D slices of the 3D data for increased readability. For more information, see Qt Data Visualization Interacting with Data.
Graph Types
The Qt Data Visualization module provides the following 3D graph types:
The QAbstract3DGraph class subclasses a QWindow and provides a render loop for its own subclasses that implement the different graph types: Q3DBars, Q3DScatter, and Q3DSurface. The graph type determines how the data is presented.
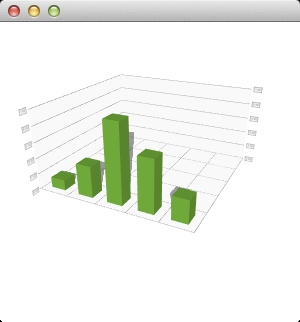
3D Bar Graphs
3D bar graphs present data as 3D bars that are grouped by category. The Q3DBars class is used to create a graph and the QBar3DSeries and QBarDataProxy classes are used to set data to the graph, as well as to control the visual properties of the graph, such as draw mode and shading. In QML, the corresponding types are Bars3D, Bar3DSeries, and BarDataProxy.
For more information, see How to construct a minimal Q3DBars graph, Bars Example, and Qt Quick 2 Bars Example.
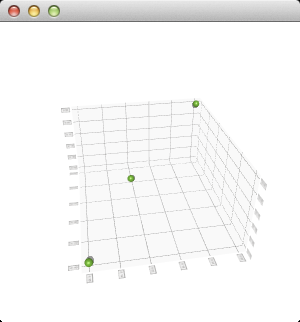
3D Scatter Graphs
3D scatter graphs present data as a collection of points. The Q3DScatter class is used to create a graph and the QScatter3DSeries and QScatterDataProxy classes are used to set data to the graph, as well as to control the visual properties of the graph. In QML, the corresponding types are Scatter3D, Scatter3DSeries, and ScatterDataProxy.
For more information, see How to construct a minimal Q3DScatter graph, Scatter Example, and Qt Quick 2 Scatter Example.
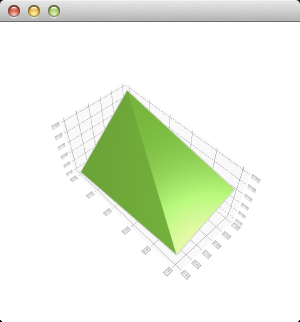
3D Surface Graphs
3D surface graphs present data as 3D surface plots. The Q3DSurface class is used to create a graph and the QSurface3DSeries and QSurfaceDataProxy classes are used to set data to the graph, as well as to control the visual properties of the graph. In QML, the corresponding types are Surface3D, Surface3DSeries, and SurfaceDataProxy.
For more information, see How to construct a minimal Q3DSurface graph, Surface Example, Textured Surface Example, Qt Quick 2 Surface Example, and Qt Quick 2 Surface Multiseries Example.
Using OpenGL for Rendering Data
It is recommended to use OpenGL 2.1 or later for data rendering. If OpenGL ES2 is used (including Angle builds in Windows), the following features are not supported:
- Shadows
- Antialiasing
- Flat shading for surfaces
- Volumetric objects, because they use 3D textures
Only OpenGL ES2 emulation is available for software renderer (that is, when using QCoreApplication::setAttribute(Qt::AA_UseSoftwareOpenGL)).
Selecting Rendering Mode
In QML, you can set the AbstractGraph3D.RenderingMode property to determine whether the graph will be rendered directly on the window background or to an offscreen surface that is then drawn during normal QML item rendering.
Background rendering modes offer slightly better performance than the indirect rendering mode, at the cost of non-standard QML behavior. For example, the graphs do not obey the z ordering of QML items and they cannot be partially transparent. Therefore, changing the rendering mode is a question of performance versus quality.
Qt Quick 2 uses a dedicated scenegraph for data rendering, and is therefore the best choice for data visualization.
3D Axes
Qt Data Visualization supports the following axis types:
- Value axis
- Category axis
An axis can be set up to show a line or a grid. Both axis types are specializations of the QAbstract3DAxis class or the AbstractAxis3D QML type.
A value axis can be given a range of values and segment and subsegment counts to divide the range into. Labels are drawn between each segment. Grid lines are drawn between each segment and each subsegment. The value axis is implemented using the QValue3DAxis class or the ValueAxis3D QML type.
A category axis has named ranges and adjustable range widths. It is divided into equal-sized categories based on the data window size defined by the axis range. Labels are drawn to the positions of categories, if provided. Grid lines are drawn between categories, if visible. A category axis is implemented using the QCategory3DAxis class or the CategoryAxis3D QML type.
If no axes are set explicitly for a graph, temporary default axes with no labels are created. These default axes can be modified via axis accessors, but as soon as any axis is set explicitly for a particular orientation, the default axis for that orientation is destroyed.
All graph types support showing multiple series simultaneously. All the series do not need to contain the same number of rows and columns. Row and column labels are taken from the first series added, unless they are explicitly defined for the row and column axes.
Axis formatters can be used to customize value axis grid lines and labels. The QValue3DAxisFormatter class and ValueAxis3DFormatter QML type provide formatting rules for a linear value 3D axis. The QLogValue3DAxisFormatter class and the LogValueAxis3DFormatter QML type provide formatting rules for a logarithmic value 3D axis.
Polar horizontal axes can be used for surface and scatter graphs by setting the polar property.
3D Themes
A theme is a built-in collection of UI style related settings applied to all the visual elements of a graph, such as the colors, fonts, and visibility of the elements, as well as the strenght of the light and ambient light.
Qt Charts comes with the following predefined themes that can be used as basis for custom themes:
- Qt is a light theme with green as the base color.
- Primary colors is a light theme with yellow as the base color.
- Digia is a light theme with gray as the base color.
- Stone moss is a medium dark theme with yellow as the base color.
- Army blue is a medium light theme with blue as the base color.
- Retro is a medium light theme with brown as the base color.
- Ebony is a dark theme with white as the base color.
- Isabelle is a dark theme with yellow as the base color.
- User defined is the default theme that is meant to be customized. For more information, see Default Theme.
Custom themes can also be created from scratch.
If a graph displays the data from several data series, some settings can be specified separately for each series. For example, different gradients can be specified for different layers of the graph to make it look more realistic. For an example, see Qt Quick 2 Surface Multiseries Example.
Customizing 3D Scenes
A 3D scene is implemented by using the Q3DScene class or the Scene3D QML type. A scene contains a single active camera, implemented by using the Q3DCamera class or the Camera3D type, and a single active light source, implemented by using the Q3DLight class or the Light3D type. The light source is always positioned in relation to the camera. By default, the light position follows the camera automatically.
The camera can be customized by specifying its preset position, rotation, and zoom level. For an example, see Qt Quick 2 Scatter Example.
Customizing Items
Qt Data Visualization has predefined mesh types for bars, items, and surfaces. The mesh type determines how a bar, an item, or a surface looks on a graph. A user-defined mesh can be specified as a Wavefront OBJ geometry definition file. For more variety, a quaternion can be set for mesh rotation.
In addition to customizing individual items, the QCustom3DItem class or the Custom3DItem QML type can be used to add custom items to graphs. The items have a custom mesh, position, scaling, rotation, and an optional texture.
The QCustom3DVolume class and the Custom3DVolume QML type can be used to create volume rendered objects to be added to a graph. A volume rendered object is a box with a 3D texture. Three slice planes are supported for the volume, one along each main axis of the volume.
The The QCustom3DLabel class and the Custom3DLabel QML type implement custom labels with the specified text, font, position, scaling, and rotation. Label colors, borders, and background are determined by the active theme.
© 2025 The Qt Company Ltd. Documentation contributions included herein are the copyrights of their respective owners. The documentation provided herein is licensed under the terms of the GNU Free Documentation License version 1.3 as published by the Free Software Foundation. Qt and respective logos are trademarks of The Qt Company Ltd. in Finland and/or other countries worldwide. All other trademarks are property of their respective owners.
