BarSeries QML Type
Presenta una serie de datos en forma de barras verticales agrupadas por categorías. Más...
| Import Statement: | import QtCharts 2.11 |
| In C++: | QBarSeries |
| Inherits: |
Descripción detallada
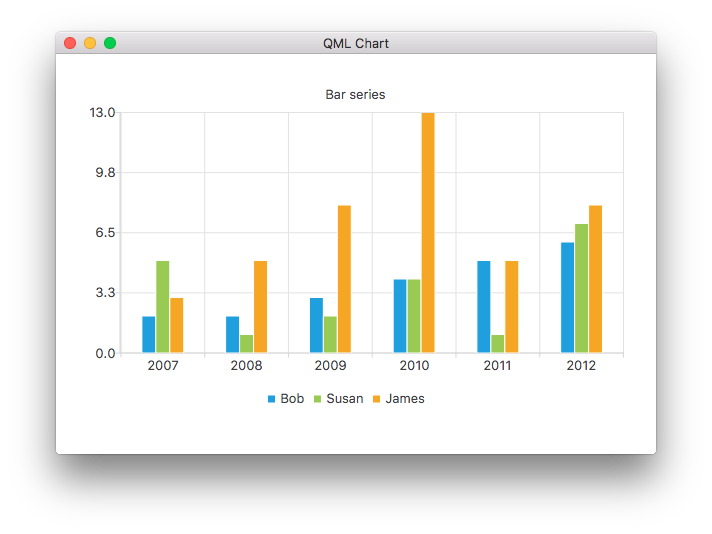
Los datos se dibujan como una serie de barras verticales agrupadas por categoría, con una barra por categoría de cada conjunto de barras añadido a la serie.
El siguiente fragmento de código QML muestra cómo crear un simple gráfico de barras agrupadas:
ChartView {
    title: "Bar Chart"
    anchors.fill: parent
    legend.alignment: Qt.AlignBottom
    antialiasing: true

    BarSeries {
        id: mySeries
        axisX: BarCategoryAxis { categories: ["2007", "2008", "2009", "2010", "2011", "2012" ] }
        BarSet { label: "Bob"; values: [2, 2, 3, 4, 5, 6] }
        BarSet { label: "Susan"; values: [5, 1, 2, 4, 1, 7] }
        BarSet { label: "James"; values: [3, 5, 8, 13, 5, 8] }
    }
}
© 2026 The Qt Company Ltd. Documentation contributions included herein are the copyrights of their respective owners. The documentation provided herein is licensed under the terms of the GNU Free Documentation License version 1.3 as published by the Free Software Foundation. Qt and respective logos are trademarks of The Qt Company Ltd. in Finland and/or other countries worldwide. All other trademarks are property of their respective owners.
