LineSeries QML Type
Presenta los datos en gráficos de líneas. Más...
| Import Statement: | import QtCharts 2.11 |
| In C++: | QLineSeries |
| Inherits: |
Propiedades
Descripción detallada
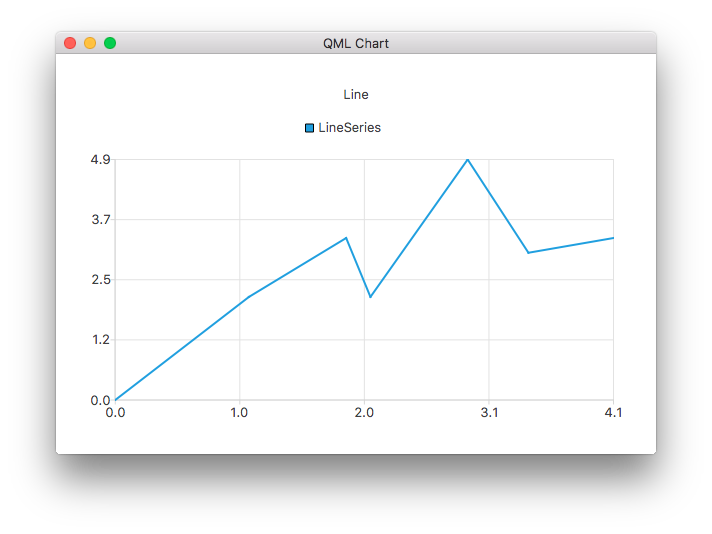
Un gráfico de líneas se utiliza para mostrar información como una serie de puntos de datos conectados por líneas rectas.
El siguiente ejemplo QML muestra cómo crear un gráfico de líneas simple:
ChartView {
    title: "Line Chart"
    anchors.fill: parent
    antialiasing: true

    LineSeries {
        name: "Line"
        XYPoint { x: 0; y: 0 }
        XYPoint { x: 1.1; y: 2.1 }
        XYPoint { x: 1.9; y: 3.3 }
        XYPoint { x: 2.1; y: 2.1 }
        XYPoint { x: 2.9; y: 4.9 }
        XYPoint { x: 3.4; y: 3.0 }
        XYPoint { x: 4.1; y: 3.3 }
    }
}
Documentación de propiedades
capStyle : Qt::PenCapStyle
Controla el estilo de tapa de la línea. Establézcalo en Qt.FlatCap, Qt.SquareCap o Qt.RoundCap. Por defecto, el estilo de tapa es Qt.SquareCap.
Véase también Qt::PenCapStyle.
count : int
El número de puntos de datos de la serie.
style : Qt::PenStyle
Controla el estilo de la línea. Establece uno de los siguientes valores: Qt.NoPen, Qt.SolidLine, Qt.DashLine, Qt.DotLine, Qt.DashDotLine o Qt.DashDotDotLine. La API QML no admite el uso de Qt.CustomDashLine. Por defecto, el estilo es Qt.SolidLine.
Véase también Qt::PenStyle.
width : real
La anchura de la línea. Por defecto, la anchura es de 2,0.
© 2026 The Qt Company Ltd. Documentation contributions included herein are the copyrights of their respective owners. The documentation provided herein is licensed under the terms of the GNU Free Documentation License version 1.3 as published by the Free Software Foundation. Qt and respective logos are trademarks of The Qt Company Ltd. in Finland and/or other countries worldwide. All other trademarks are property of their respective owners.
