PercentBarSeries QML Type
Presenta una serie de datos categorizados como porcentaje de cada categoría. Más...
| Import Statement: | import QtCharts 2.11 |
| In C++: | QPercentBarSeries |
| Inherits: |
Descripción detallada
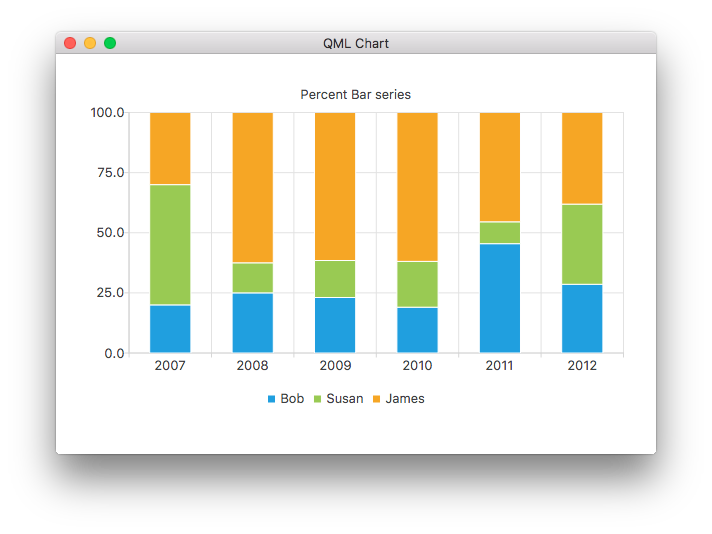
Los datos se dibujan como una serie de barras apiladas verticalmente de tamaño uniforme, con una barra por categoría. Cada conjunto de barras añadido a la serie aporta un único segmento a cada barra apilada. El tamaño del segmento corresponde al porcentaje del valor del segmento comparado con el valor total de todos los segmentos de la pila. Las barras con valor cero no se dibujan.
El siguiente fragmento de código QML muestra cómo crear un simple gráfico de barras porcentuales:
ChartView {
    title: "Percent Bar Chart"
    anchors.fill: parent
    legend.alignment: Qt.AlignBottom
    antialiasing: true

    PercentBarSeries {
        axisX: BarCategoryAxis { categories: ["2007", "2008", "2009", "2010", "2011", "2012" ] }
        BarSet { label: "Bob"; values: [2, 2, 3, 4, 5, 6] }
        BarSet { label: "Susan"; values: [5, 1, 2, 4, 1, 7] }
        BarSet { label: "James"; values: [3, 5, 8, 13, 5, 8] }
    }
}
© 2026 The Qt Company Ltd. Documentation contributions included herein are the copyrights of their respective owners. The documentation provided herein is licensed under the terms of the GNU Free Documentation License version 1.3 as published by the Free Software Foundation. Qt and respective logos are trademarks of The Qt Company Ltd. in Finland and/or other countries worldwide. All other trademarks are property of their respective owners.
