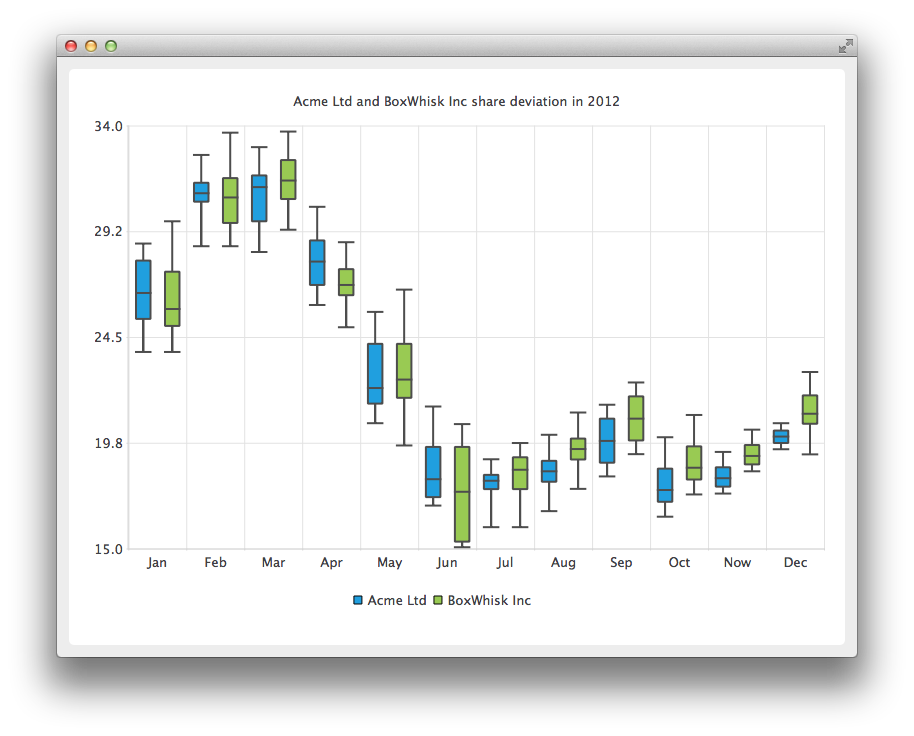
箱ひげ図の作成
注: これは、Charts with Widgets Galleryの例の一部です。
この例題では、ファイルから非連続データを読み込んで整理し、箱ひげ図に必要な中央値を求める方法も示しています。

2つの会社のシェア偏差を表示するために、まず月次データを扱う2つのQBoxPlotSeries 。
auto acmeSeries = new QBoxPlotSeries;
acmeSeries->setName("Acme Ltd");

auto boxWhiskSeries = new QBoxPlotSeries;
boxWhiskSeries->setName("BoxWhisk Inc");
QFile BoxDataReaderクラスは、非連続データが保存されているテキスト・ファイルをオープンするために使用されます。BoxDataReader は、テキスト・ファイルを読み込んで、データから極値と中央値を求めるための補助クラスです。BoxDataReader については後で詳しく説明します。メソッド readBox は値を読み取り、メソッドが呼び出し元に返すQBoxSet アイテムに設定します。返されたQBoxSet アイテムがシリーズに追加されます。
QFile acmeData(":boxplot_a");
const QString errorTemplate = QStringLiteral("Failed to load '%1' file.");
if (!acmeData.open(QIODevice::ReadOnly | QIODevice::Text)) {
    m_loadError = errorTemplate.arg(acmeData.fileName());
    return false;
}

BoxPlotDataReader dataReader(&acmeData);
while (!dataReader.atEnd()) {
    QBoxSet *set = dataReader.readBox();
    if (set)
        acmeSeries->append(set);
}
このセクションでは、2つ目の会社のデータを読み込むために2つ目のファイルがオープンされます。
QFile boxwhiskData(":boxplot_b");
if (!boxwhiskData.open(QIODevice::ReadOnly | QIODevice::Text)) {
    m_loadError = errorTemplate.arg(acmeData.fileName());
    return false;
}

dataReader.readFile(&boxwhiskData);
while (!dataReader.atEnd()) {
    QBoxSet *set = dataReader.readBox();
    if (set)
        boxWhiskSeries->append(set);
}
このコード・スニペットでは、新しいQChart インスタンスが作成され、以前に作成されたシリーズがそれに追加されます。タイトルも定義され、アニメーションはSeriesAnimationに設定されています。
auto chart = new QChart;
chart->addSeries(acmeSeries);
chart->addSeries(boxWhiskSeries);
chart->setTitle("Acme Ltd. and BoxWhisk Inc. share deviation in 2012");
chart->setAnimationOptions(QChart::SeriesAnimations);
ここでは、プレゼンテーション用のデフォルトの軸を作成するようにチャートに依頼しています。また、チャートから軸のポインタをクエリして縦軸の範囲を設定し、その軸の最小値と最大値を設定します。
chart->createDefaultAxes();
chart->axes(Qt::Vertical).first()->setMin(15.0);
chart->axes(Qt::Horizontal).first()->setMax(34.0);
このセクションでは、凡例を表示するように設定し、それをチャートの下部に配置します。
chart->legend()->setVisible(true);
chart->legend()->setAlignment(Qt::AlignBottom);
最後に、チャートをビューに追加します。また、chartViewのアンチエイリアスをオンにします。
createDefaultChartView(chart);
これでチャートを表示する準備が整いました。
ここでは readBox メソッドについて詳しく説明する。
まず、ファイルから1行が読み込まれ、#で始まる行はコメント行とみなされるため拒否される。
QString line = m_textStream.readLine();
if (line.startsWith("#"))
    return nullptr;
このファイルでは、データは数字、空白、数字、空白の順に並んでいる。このスニペットでは、行は1つの数字列に分割され、QStringList に格納される。
QStringList strList = line.split(QLatin1Char(' '), Qt::SkipEmptyParts);
sortedListは数字を連続した順序で保持する。まずsortedListがクリアされ、strListから数字が読み込まれ、sortedListにdouble形式で格納される。qSortメソッドはsortedListを小さいものから順番に並べていく。
m_sortedList.clear();
for (int i = 1; i < strList.count(); i++)
    m_sortedList.append(strList.at(i).toDouble());

std::sort(m_sortedList.begin(), m_sortedList.end());
以下は、連続データから極値と中央値を選択する方法を示すコードサンプルである。まず、新しいQBoxSet が作成される。下限と上限の選択方法は簡単で、sortedList の最初と最後の項目を選択するだけです。中央値については、後で説明するヘルパー・メソッド findMedian を使います。上半分の中央値については、数値の量が偶数か不均等か、開始数値を調整する必要がある。下半分の終了数は、intの丸めから自然に得られます。
auto box = new QBoxSet(strList.first());
box->setValue(QBoxSet::LowerExtreme, m_sortedList.first());
box->setValue(QBoxSet::UpperExtreme, m_sortedList.last());
box->setValue(QBoxSet::Median, findMedian(0, count));
box->setValue(QBoxSet::LowerQuartile, findMedian(0, count / 2));
box->setValue(QBoxSet::UpperQuartile, findMedian(count / 2 + (count % 2), count));
以下にfindMedianメソッドのコードサンプルを示します。数値の量が不均等な場合は、真ん中の数値を選択します。偶数の場合は真ん中から2つ取って平均値を計算します。
© 2025 The Qt Company Ltd. Documentation contributions included herein are the copyrights of their respective owners. The documentation provided herein is licensed under the terms of the GNU Free Documentation License version 1.3 as published by the Free Software Foundation. Qt and respective logos are trademarks of The Qt Company Ltd. in Finland and/or other countries worldwide. All other trademarks are property of their respective owners.

