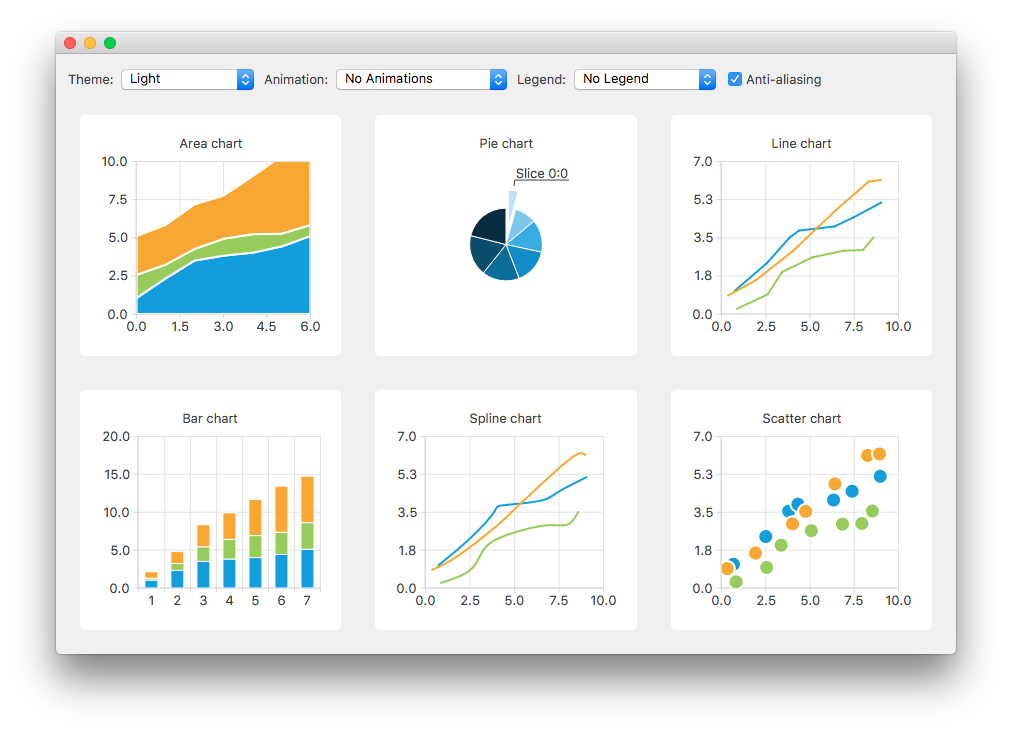
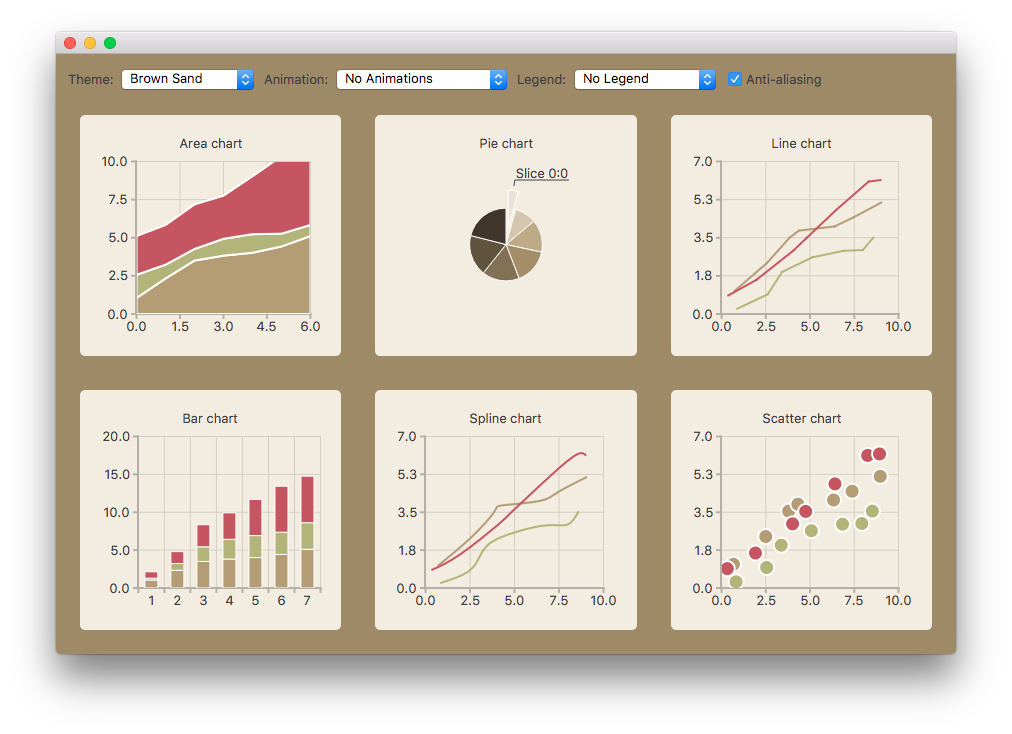
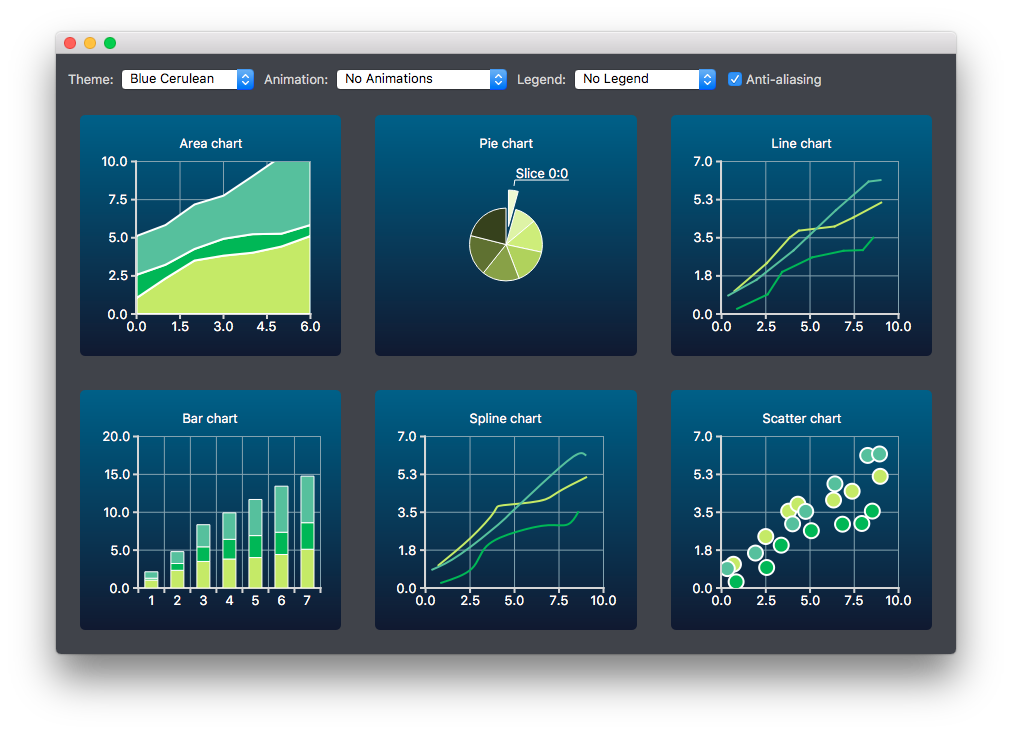
テーマでチャートを作成する
注: これはCharts with Widgets Galleryの例の一部です。
ここでは、サポートされているチャート・タイプのいくつかについて、さまざまな組み込みテーマのルック&フィールを変更します。


チャートの作成
異なるタイプのチャートは別々に生成され、レイアウトに追加されます。例えば、折れ線グラフは次のように作成されます。他の種類のチャートの作成も同様です。
まずチャートが作成される。
auto chart = new QChart;
chart->setTitle("Line Chart");
共通のランダム・データが生成され、リストに入れられる。このリストは、各チャート・タイプで、チャートの系列にデータを追加するために使われる。線分系列については、QLineSeries インスタンスが作成され、チャートに追加される。
QString name("Series ");
int nameIndex = 0;
for (const DataList &list : m_dataTable) {
    auto series = new QLineSeries(chart);
    for (const Data &data : list)
        series->append(data.first);
    series->setName(name + QString::number(nameIndex));
    nameIndex++;
    chart->addSeries(series);
}
線分系列には、デフォルトの軸が作成される。また、系列に使用されるデータの範囲に基づいて、軸の範囲を指定します。
chart->createDefaultAxes();
chart->axes(Qt::Horizontal).first()->setRange(0, m_valueMax);
chart->axes(Qt::Vertical).first()->setRange(0, m_valueCount);
また、ラベルとY軸の間にスペースを追加したい。そのために、ラベルにスペース文字を追加するラベル・フォーマットを指定します。
// Add space to label to add space between labels and axis
auto axisY = qobject_cast<QValueAxis *>(chart->axes(Qt::Vertical).first());
Q_ASSERT(axisY);
axisY->setLabelFormat("%.1f  ");
最後に、折れ線グラフをグリッド・レイアウトに追加します。
chartView = new QChartView(createLineChart(), this);
m_ui->gridLayout->addWidget(chartView, 1, 2);
テーマの変更
ユーザーは、この例で使用する組み込みテーマを選択することができる。このテーマは、レイアウト内のすべてのチャートに適用される。
auto theme = static_cast<QChart::ChartTheme>(
            m_ui->themeComboBox->itemData(m_ui->themeComboBox->currentIndex()).toInt());
    ...
chartView->chart()->setTheme(theme);
アニメーション、凡例、アンチエイリアスの変更
この例では、アニメーション、凡例、アンチエイリアスを変更することが、チャートの外観にどのように影響するかを見ることもできる。
ユーザーの選択に基づいて、使用されるアニメーション・タイプが各チャートに設定されます。チャートにアニメーションを表示しないことも、グリッド軸や系列にアニメーションを表示することも、その両方を表示することもできる。
QChart::AnimationOptions options(
            m_ui->animatedComboBox->itemData(m_ui->animatedComboBox->currentIndex()).toInt());
if (!m_charts.isEmpty() && m_charts.at(0)->chart()->animationOptions() != options) {
    for (QChartView *chartView : charts)
        chartView->chart()->setAnimationOptions(options);
}
チャートは凡例とともに表示できる。凡例は、チャートのさまざまな側に整列させることができる。
Qt::Alignment alignment(
            m_ui->legendComboBox->itemData(m_ui->legendComboBox->currentIndex()).toInt());

if (!alignment) {
    for (QChartView *chartView : charts)
        chartView->chart()->legend()->hide();
} else {
    for (QChartView *chartView : charts) {
        chartView->chart()->legend()->setAlignment(alignment);
        chartView->chart()->legend()->show();
    }
}
アンチエイリアス・オプションを変更すると、チャートの外観がどのように変わるかを見ることもできる。アンチエイリアスは、ユーザーの選択に基づいて更新されます。
bool checked = m_ui->antialiasCheckBox->isChecked();
for (QChartView *chart : charts)
    chart->setRenderHint(QPainter::Antialiasing, checked);
© 2025 The Qt Company Ltd. Documentation contributions included herein are the copyrights of their respective owners. The documentation provided herein is licensed under the terms of the GNU Free Documentation License version 1.3 as published by the Free Software Foundation. Qt and respective logos are trademarks of The Qt Company Ltd. in Finland and/or other countries worldwide. All other trademarks are property of their respective owners.

