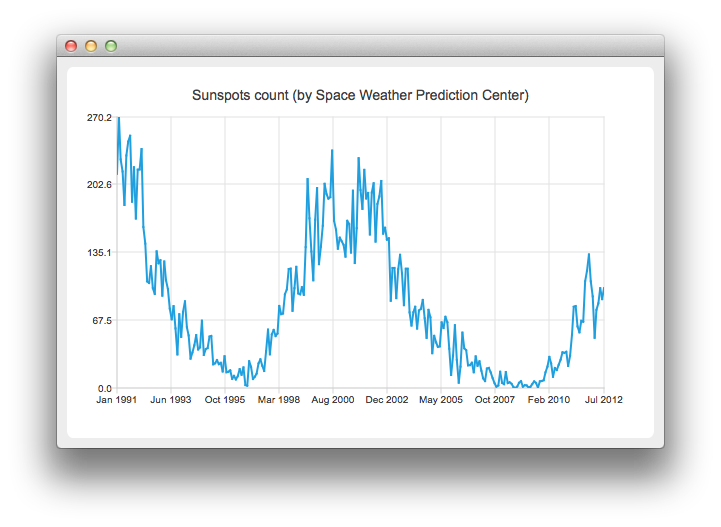
日付軸と時間軸を持つ折れ線グラフ
注: これは、ウィジェット・ギャラリーによるチャートの例の一部です。

例の実行
から例を実行するには Qt Creatorからサンプルを実行するには、Welcome モードを開き、Examples からサンプルを選択します。詳細については、Qt Creator:Tutorialを参照してください:ビルドと実行。
折れ線グラフの作成
折れ線グラフを作成するには、QLineSeries インスタンスが必要である。作ってみよう。
auto series = new QLineSeries;
太陽黒点の数が時間的にどのように変化するかをグラフで示す。データ(宇宙天気予報センターから)はテキストファイルから読み込む。
下のスニペットでは、QDateTime::toMSecsSinceEpoch メソッドを使って、QDateTime オブジェクトをQLineSeries append メソッドに渡せる数値に変換していることに注目してほしい。
// data from http://www.swpc.noaa.gov/ftpdir/weekly/RecentIndices.txt
// http://www.swpc.noaa.gov/ftpdir/weekly/README
// http://www.weather.gov/disclaimer
QFile sunSpots(":sun_spots");
if (!sunSpots.open(QIODevice::ReadOnly | QIODevice::Text)) {
    m_loadError = QStringLiteral("Failed to load '%1' file.").arg(sunSpots.fileName());
    return false;
}

QTextStream stream(&sunSpots);
while (!stream.atEnd()) {
    QString line = stream.readLine();
    if (line.startsWith("#") || line.startsWith(":"))
        continue;
    QStringList values = line.split(QLatin1Char(' '), Qt::SkipEmptyParts);
    QDateTime momentInTime;
    momentInTime.setDate(QDate(values[0].toInt(), values[1].toInt() , 15));
    series->append(momentInTime.toMSecsSinceEpoch(), values[2].toDouble());
}
sunSpots.close();
チャート上にデータを表示するには、QChart インスタンスが必要です。これに系列を追加し、凡例を非表示にし、デフォルトの軸を作成し、チャートのタイトルを設定します。
auto chart = new QChart;
chart->addSeries(series);
chart->legend()->hide();
chart->setTitle("Sunspots count (by Space Weather Prediction Center)");
ここではQLineSeries を使用しているので、createDefaultAxes を呼び出すと、X軸とY軸の両方としてQValueAxis が作成される。QDateTimeAxis を使用するには、これを手動でチャートに設定する必要がある。まず、QDateTimeAxis のインスタンスを作成し、次に表示する目盛りの数を設定する。太陽黒点の数は、その月の平均値として提供される。したがって、軸ラベルに時刻と曜日に関する情報を含める必要はない。これは、カスタム・ラベル・フォーマットを設定することで実現できる。利用可能な形式オプションについては、QDateTime::toString() メソッドのドキュメントを参照してください。
auto axisX = new QDateTimeAxis;
axisX->setTickCount(10);
axisX->setFormat("MMM yyyy");
axisX->setTitleText("Date");
chart->addAxis(axisX, Qt::AlignBottom);
series->attachAxis(axisX);

auto axisY = new QValueAxis;
axisY->setLabelFormat("%i");
axisY->setTitleText("Sunspots count");
chart->addAxis(axisY, Qt::AlignLeft);
series->attachAxis(axisY);
次に、QChart をパラメータとしてQChartView オブジェクトを作成します。こうすることで、QGraphicsView シーンを作成する必要がなくなります。また、レンダリングされた線がよりきれいに見えるように、アンチエイリアスをオンに設定します。
createDefaultChartView(chart);
これでチャートを表示する準備ができました。
© 2025 The Qt Company Ltd. Documentation contributions included herein are the copyrights of their respective owners. The documentation provided herein is licensed under the terms of the GNU Free Documentation License version 1.3 as published by the Free Software Foundation. Qt and respective logos are trademarks of The Qt Company Ltd. in Finland and/or other countries worldwide. All other trademarks are property of their respective owners.

