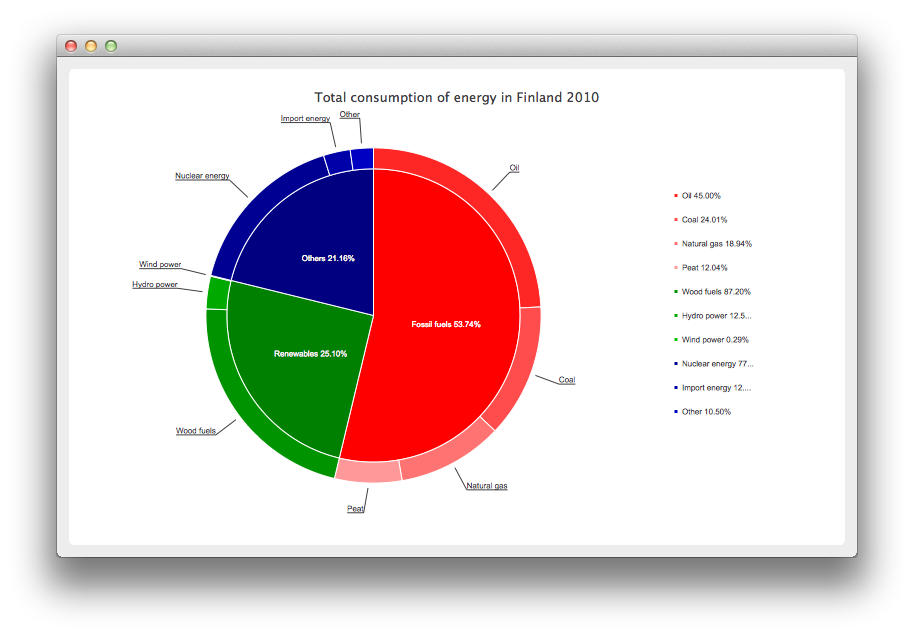
ドーナツ・ブレイクダウン・チャートの作成
注: これは、ウィジェット・ギャラリーを使ったチャートの例の一部です。

ドーナツ・ブレイクダウン・チャートの作成
チャート用のデータを定義することから始めましょう。
// Graph is based on data of 'Total consumption of energy increased by 10 per cent in 2010'
// Statistics Finland, 13 December 2011
// http://www.stat.fi/til/ekul/2010/ekul_2010_2011-12-13_tie_001_en.html

auto series1 = new QPieSeries;
series1->setName("Fossil fuels");
series1->append("Oil", 353295);
series1->append("Coal", 188500);
series1->append("Natural gas", 148680);
series1->append("Peat", 94545);

auto series2 = new QPieSeries;
series2->setName("Renewables");
series2->append("Wood fuels", 319663);
series2->append("Hydro power", 45875);
series2->append("Wind power", 1060);

auto series3 = new QPieSeries;
series3->setName("Others");
series3->append("Nuclear energy", 238789);
series3->append("Import energy", 37802);
series3->append("Other", 32441);
そして、そのデータを追加するチャートを作成します。これはQChart から派生した独自のチャートであることに注意してください。
auto donutBreakdown = new DonutBreakdownChart;
donutBreakdown->setAnimationOptions(QChart::AllAnimations);
donutBreakdown->setTitle("Total consumption of energy in Finland 2010");
donutBreakdown->legend()->setAlignment(Qt::AlignRight);
donutBreakdown->addBreakdownSeries(series1, Qt::red);
donutBreakdown->addBreakdownSeries(series2, Qt::darkGreen);
donutBreakdown->addBreakdownSeries(series3, Qt::darkBlue);
この独自のチャートは、コンストラクタで主系列を作成し、内訳系列が提供するデータを集約する主系列を作成するように動作します。これが中央の円グラフです。
DonutBreakdownChart::DonutBreakdownChart(QGraphicsItem *parent, Qt::WindowFlags wFlags)
    : QChart(QChart::ChartTypeCartesian, parent, wFlags)
{
    // create the series for main center pie
    m_mainSeries = new QPieSeries;
    m_mainSeries->setPieSize(0.7);
    QChart::addSeries(m_mainSeries);
}
内訳系列が追加されると、データはメイン系列のスライスを作成するために使用され、内訳系列自体は、メイン系列の対応するスライスと整列するように配置されたドーナツのセグメントを作成するために使用されます。
void DonutBreakdownChart::addBreakdownSeries(QPieSeries *breakdownSeries, QColor color)
{
    QFont font("Arial", 8);

    // add breakdown series as a slice to center pie
    auto mainSlice = new DonutBreakdownMainSlice(breakdownSeries);
    mainSlice->setName(breakdownSeries->name());
    mainSlice->setValue(breakdownSeries->sum());
    m_mainSeries->append(mainSlice);

    // customize the slice
    mainSlice->setBrush(color);
    mainSlice->setLabelVisible();
    mainSlice->setLabelColor(Qt::white);
    mainSlice->setLabelPosition(QPieSlice::LabelInsideHorizontal);
    mainSlice->setLabelFont(font);

    // position and customize the breakdown series
    breakdownSeries->setPieSize(0.8);
    breakdownSeries->setHoleSize(0.7);
    breakdownSeries->setLabelsVisible();
    const auto slices = breakdownSeries->slices();
    for (QPieSlice *slice : slices) {
        color = color.lighter(115);
        slice->setBrush(color);
        slice->setLabelFont(font);
    }

    // add the series to the chart
    QChart::addSeries(breakdownSeries);

    // recalculate breakdown donut segments
    recalculateAngles();

    // update customize legend markers
    updateLegendMarkers();
}
ドーナツセグメントの開始角度と終了角度の計算方法を示します。
void DonutBreakdownChart::recalculateAngles()
{
    qreal angle = 0;
    const auto slices = m_mainSeries->slices();
    for (QPieSlice *slice : slices) {
        QPieSeries *breakdownSeries = qobject_cast<DonutBreakdownMainSlice *>(slice)->breakdownSeries();
        breakdownSeries->setPieStartAngle(angle);
        angle += slice->percentage() * 360.0; // full pie is 360.0
        breakdownSeries->setPieEndAngle(angle);
    }
}
凡例マーカーは、内訳パーセンテージを表示するようにカスタマイズされます。メイン・レベル・スライスのマーカーは非表示です。
void DonutBreakdownChart::updateLegendMarkers()
{
    // go through all markers
    const auto allseries = series();
    for (QAbstractSeries *series : allseries) {
        const auto markers = legend()->markers(series);
        for (QLegendMarker *marker : markers) {
            auto pieMarker = qobject_cast<QPieLegendMarker *>(marker);
            if (series == m_mainSeries) {
                // hide markers from main series
                pieMarker->setVisible(false);
            } else {
                // modify markers from breakdown series
                pieMarker->setLabel(QString("%1 %2%")
                                    .arg(pieMarker->slice()->label())
                                    .arg(pieMarker->slice()->percentage() * 100, 0, 'f', 2));
                pieMarker->setFont(QFont("Arial", 8));
            }
        }
    }
}
代わりに、メイン・レベルのスライスは、ラベルにパーセンテージを表示します。
DonutBreakdownMainSlice::DonutBreakdownMainSlice(QPieSeries *breakdownSeries, QObject *parent)
    : QPieSlice(parent),
      m_breakdownSeries(breakdownSeries)
{
    connect(this, &DonutBreakdownMainSlice::percentageChanged,
            this, &DonutBreakdownMainSlice::updateLabel);
}
    ...
void DonutBreakdownMainSlice::updateLabel()
{
    setLabel(QString("%1 %2%").arg(m_name).arg(percentage() * 100, 0, 'f', 2));
}
これでチャートが定義されたので、最後にQChartView を作成してチャートを表示できます。
createDefaultChartView(donutBreakdown);
© 2025 The Qt Company Ltd. Documentation contributions included herein are the copyrights of their respective owners. The documentation provided herein is licensed under the terms of the GNU Free Documentation License version 1.3 as published by the Free Software Foundation. Qt and respective logos are trademarks of The Qt Company Ltd. in Finland and/or other countries worldwide. All other trademarks are property of their respective owners.

