
横長のパーセント棒グラフの作成
注:これは 「ウィジェット付きグラフギャラリー」のサンプルの一部です。
水平パーセント棒グラフは、セット内のデータを、カテゴリごとの全セットに対する割合として表示します。
横型パーセント棒グラフの作成方法は、通常の棒グラフの作成方法とほぼ同じですが、横型パーセント棒グラフでは、QBarSeriesの代わりにQHorizontalPercentBarSeries APIを使用する点が異なります。 また、棒グラフでは、Y軸の目盛りをより見やすくするために「nicesnumbers」アルゴリズムを使用していました。パーセント棒グラフの場合、Y軸の最大値は常に100であるため、その必要はありません。
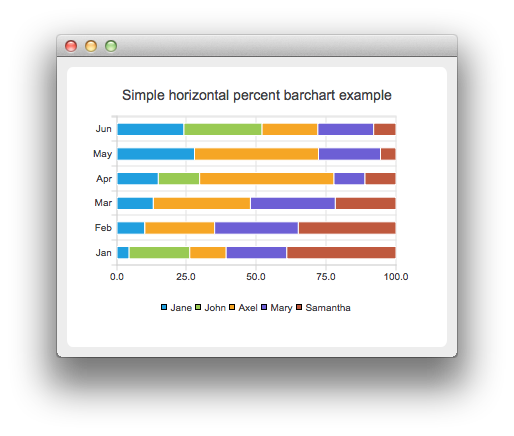
バーセットの使用方法は、すべての棒グラフで共通です。各種棒グラフの違いを明確にするため、例では同じデータを使用します。棒グラフで可視化されるデータは、QBarSetインスタンスによって定義されます。 ここでは、セットを作成し、そこにデータを追加します。データの追加には << 演算子が使用されます。あるいは、append メソッドを使用することも可能です。
auto set0 = new QBarSet("Jane");
auto set1 = new QBarSet("John");
auto set2 = new QBarSet("Axel");
auto set3 = new QBarSet("Mary");
auto set4 = new QBarSet("Samantha");

*set0 << 1 << 2 << 3 << 4 << 5 << 6;
*set1 << 5 << 0 << 0 << 4 << 0 << 7;
*set2 << 3 << 5 << 8 << 13 << 8 << 5;
*set3 << 5 << 6 << 7 << 3 << 4 << 5;
*set4 << 9 << 7 << 5 << 3 << 1 << 2;
シリーズを作成し、そこにバーセットを追加します。シリーズはバーセットの所有権を引き継ぎます。シリーズは、セット内のデータをカテゴリごとにグループ化します。各セットの最初の値は最初のカテゴリに、2番目の値は2番目のカテゴリに、というようにグループ化されます。
auto series = new QHorizontalPercentBarSeries;
series->append(set0);
series->append(set1);
series->append(set2);
series->append(set3);
series->append(set4);
ここでは、チャートオブジェクトを作成し、そこにシリーズを追加します。setTitle を使用してチャートのタイトルを設定し、setAnimationOptions(QChart::SeriesAnimations) を呼び出してシリーズのアニメーションを有効にします。
auto chart = new QChart;
chart->addSeries(series);
chart->setTitle("Simple Horizontal Percent Bar Chart");
chart->setAnimationOptions(QChart::SeriesAnimations);
カテゴリを軸上に表示するには、まず QBarCategoryAxis を作成する必要があります。 ここでは、カテゴリのリストを使用してカテゴリ軸を作成し、それをチャートの左側にY軸として追加します。チャートがこの軸を管理します。X軸には、下部に配置された値軸を使用します。
QStringList categories {"Jan", "Feb", "Mar", "Apr", "May", "Jun"};
auto axisY = new QBarCategoryAxis;
axisY->append(categories);
chart->addAxis(axisY, Qt::AlignLeft);
series->attachAxis(axisY);
auto axisX = new QValueAxis;
chart->addAxis(axisX, Qt::AlignBottom);
series->attachAxis(axisX);
また、凡例も表示したいです。そのためには、チャートから凡例のポインタを取得し、表示するように設定します。さらに、配置を `Qt::AlignBottom` に設定することで、凡例をチャートの下部に配置します。
chart->legend()->setVisible(true);
chart->legend()->setAlignment(Qt::AlignBottom);
最後に、チャートをビューに追加します。
createDefaultChartView(chart);© 2026 The Qt Company Ltd. Documentation contributions included herein are the copyrights of their respective owners. The documentation provided herein is licensed under the terms of the GNU Free Documentation License version 1.3 as published by the Free Software Foundation. Qt and respective logos are trademarks of The Qt Company Ltd. in Finland and/or other countries worldwide. All other trademarks are property of their respective owners.
