Creating Polar Charts
Note: This is part of the Charts with Widgets Gallery example.
It also shows how to implement scrolling and zooming of the polar chart as well as visually demonstrate how polar charts and Cartesian charts relate to each other.
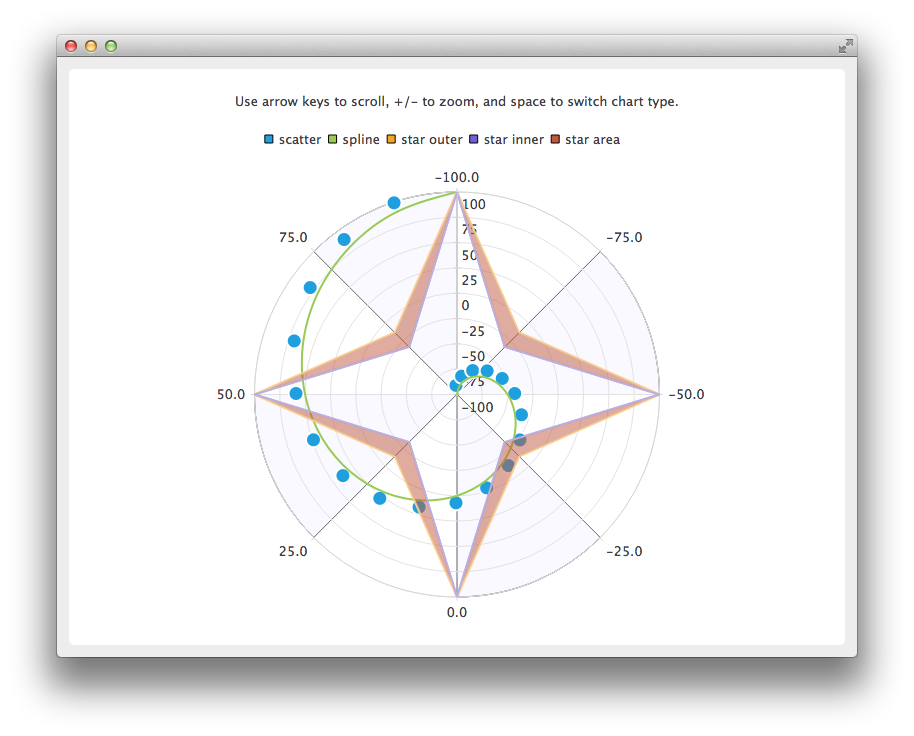
Creating a polar chart is done with a QPolarChart instance instead of a QChart instance.
auto chart = new QPolarChart;
Axes are created similarly to Cartesian charts, but when axes are added to the chart, you can use polar orientations instead of alignments.
auto angularAxis = new QValueAxis;
angularAxis->setTickCount(9); // First and last ticks are co-located on 0/360 angle.
angularAxis->setLabelFormat("%.1f");
angularAxis->setShadesVisible(true);
angularAxis->setShadesBrush(QBrush(QColor(249, 249, 255)));
chart->addAxis(angularAxis, QPolarChart::PolarOrientationAngular);

auto radialAxis = new QValueAxis;
radialAxis->setTickCount(9);
radialAxis->setLabelFormat("%d");
chart->addAxis(radialAxis, QPolarChart::PolarOrientationRadial);
Zooming and scrolling of a polar chart is logically nearly identical to zooming and scrolling of a Cartesian chart. The main difference is that when scrolling along the X-axis (angular axis), the angle is used instead of the number of pixels. Another difference is that zooming to a rectangle cannot be done.
void PolarChartView::keyPressEvent(QKeyEvent *event)
{
    switch (event->key()) {
    case Qt::Key_Plus:
        chart()->zoomIn();
        break;
    case Qt::Key_Minus:
        chart()->zoomOut();
        break;
    case Qt::Key_Left:
        chart()->scroll(-1.0, 0);
        break;
    case Qt::Key_Right:
        chart()->scroll(1.0, 0);
        break;
    case Qt::Key_Up:
        chart()->scroll(0, 1.0);
        break;
    case Qt::Key_Down:
        chart()->scroll(0, -1.0);
        break;
    case Qt::Key_Space:
        switchChartType();
        break;
    default:
        QGraphicsView::keyPressEvent(event);
        break;
    }
}
The same axes and series can be used in both cartesian and polar charts, though not simultaneously. To switch between chart types, you first need to remove the series and axes from the old chart, and then add them to the new chart. If you want to preserve the axis ranges, those need to be copied, too.
void PolarChartView::switchChartType()
{
    QChart *newChart;
    QChart *oldChart = chart();

    if (oldChart->chartType() == QChart::ChartTypeCartesian)
        newChart = new QPolarChart;
    else
        newChart = new QChart;

    // Move series and axes from old chart to new one
    const QList<QAbstractSeries *> seriesList = oldChart->series();
    const QList<QAbstractAxis *> axisList = oldChart->axes();
    QList<QPair<qreal, qreal> > axisRanges;

    for (QAbstractAxis *axis : axisList) {
        auto valueAxis = static_cast<QValueAxis *>(axis);
        axisRanges.append(QPair<qreal, qreal>(valueAxis->min(), valueAxis->max()));
    }

    for (QAbstractSeries *series : seriesList)
        oldChart->removeSeries(series);

    for (QAbstractAxis *axis : axisList) {
        oldChart->removeAxis(axis);
        newChart->addAxis(axis, axis->alignment());
    }

    for (QAbstractSeries *series : seriesList) {
        newChart->addSeries(series);
        for (QAbstractAxis *axis : axisList)
            series->attachAxis(axis);
    }

    int count = 0;
    for (QAbstractAxis *axis : axisList) {
        axis->setRange(axisRanges[count].first, axisRanges[count].second);
        count++;
    }

    newChart->setTitle(oldChart->title());
    setChart(newChart);
    delete oldChart;
}
© 2026 The Qt Company Ltd. Documentation contributions included herein are the copyrights of their respective owners. The documentation provided herein is licensed under the terms of the GNU Free Documentation License version 1.3 as published by the Free Software Foundation. Qt and respective logos are trademarks of The Qt Company Ltd. in Finland and/or other countries worldwide. All other trademarks are property of their respective owners.
