Surface Graph Gallery
Gallery with three different ways to use a Surface3D graph.
Surface Graph Gallery demonstrates three different custom features with Surface3D graphs. The features have their own tabs in the application.
The following sections concentrate on those features only and skip explaining the basic functionality - for more detailed QML example documentation, see Simple Scatter Graph.
Running the Example
To run the example from Qt Creator, open the Welcome mode and select the example from Examples. For more information, see Qt Creator: Tutorial: Build and run.
Height Map
In the Height Map tab, generate a surface graph from height data. The data used is a height map of Mount Ruapehu and Mount Ngauruhoe in New Zealand.
Adding Data to the Graph
The data is set using HeightMapSurfaceDataProxy, which reads height information from a height map image. The proxy itself is contained in a Surface3DSeries. Inside the HeightMapSurfaceDataProxy the heightMapFile property specifies the image file containing the height data. The value properties in the proxy define the minimum and maximum values for surface area width, depth, and height. The z and x values are in latitude and longitude, approximately at the real-world position, and the y is in meters.
Note: The aspect ratio of the graph is not set to real-life scale, but the height is exaggerated instead.
Surface3DSeries {
    id: heightSeries
    flatShadingEnabled: false
    drawMode: Surface3DSeries.DrawSurface

    HeightMapSurfaceDataProxy {
        heightMapFile: "://qml/qmlsurfacegallery/heightmap.png"
        // We don't want the default data values set by heightmap proxy, but use
        // actual coordinate and height values instead
        autoScaleY: true
        minYValue: 740
        maxYValue: 2787
        minZValue: -374 // ~ -39.374411"N
        maxZValue: -116 // ~ -39.115971"N
        minXValue: 472  // ~ 175.471767"E
        maxXValue: 781  // ~ 175.780758"E
    }

    onDrawModeChanged: heightMapView.checkState()
}
Displaying the Data
In main.qml, set up the Surface3D element to display the data.
First, define the custom gradient to be used for the surface. Set the colors from position 0.0 to 1.0 with ColorGradient, with two extra stops to make the graph more vivid:
ColorGradient {
    id: surfaceGradient
    ColorGradientStop { position: 0.0; color: "darkgreen"}
    ColorGradientStop { position: 0.15; color: "darkslategray" }
    ColorGradientStop { position: 0.7; color: "peru" }
    ColorGradientStop { position: 1.0; color: "white" }
}
Set this element into the baseGradients property in the theme used in Surface3D:
theme: Theme3D {
    type: Theme3D.ThemeStoneMoss
    font.family: "STCaiyun"
    font.pointSize: 35
    colorStyle: Theme3D.ColorStyleRangeGradient
    baseGradients: [surfaceGradient] // Use the custom gradient
}
Use the buttons to control other Surface3D features.
The first button toggles on and off the surface grid. The draw mode cannot be cleared completely, so unless the surface itself is visible, the surface grid cannot be hidden:
onClicked: {
    if (heightSeries.drawMode & Surface3DSeries.DrawWireframe)
        heightSeries.drawMode &= ~Surface3DSeries.DrawWireframe;
    else
        heightSeries.drawMode |= Surface3DSeries.DrawWireframe;
}
The second one sets the surface grid color:
onClicked: {
    if (Qt.colorEqual(heightSeries.wireframeColor, "#000000")) {
        heightSeries.wireframeColor = "red";
        text = "Black surface\ngrid color";
    } else {
        heightSeries.wireframeColor = "black";
        text = "Red surface\ngrid color";
    }
}
The third one toggles the surface on or off in the surface draw mode. The draw mode cannot be cleared completely, so unless the surface grid is visible, the surface itself cannot be hidden:
onClicked: {
    if (heightSeries.drawMode & Surface3DSeries.DrawSurface)
        heightSeries.drawMode &= ~Surface3DSeries.DrawSurface;
    else
        heightSeries.drawMode |= Surface3DSeries.DrawSurface;
}
The fourth sets the for shading mode. If you are running the example on OpenGL ES system, flat shading is not available:
onClicked: {
    if (heightSeries.flatShadingEnabled) {
        heightSeries.flatShadingEnabled = false;
        text = "Show\nFlat"
    } else {
        heightSeries.flatShadingEnabled = true;
        text = "Show\nSmooth"
    }
}
The remaining buttons control the graph background features.
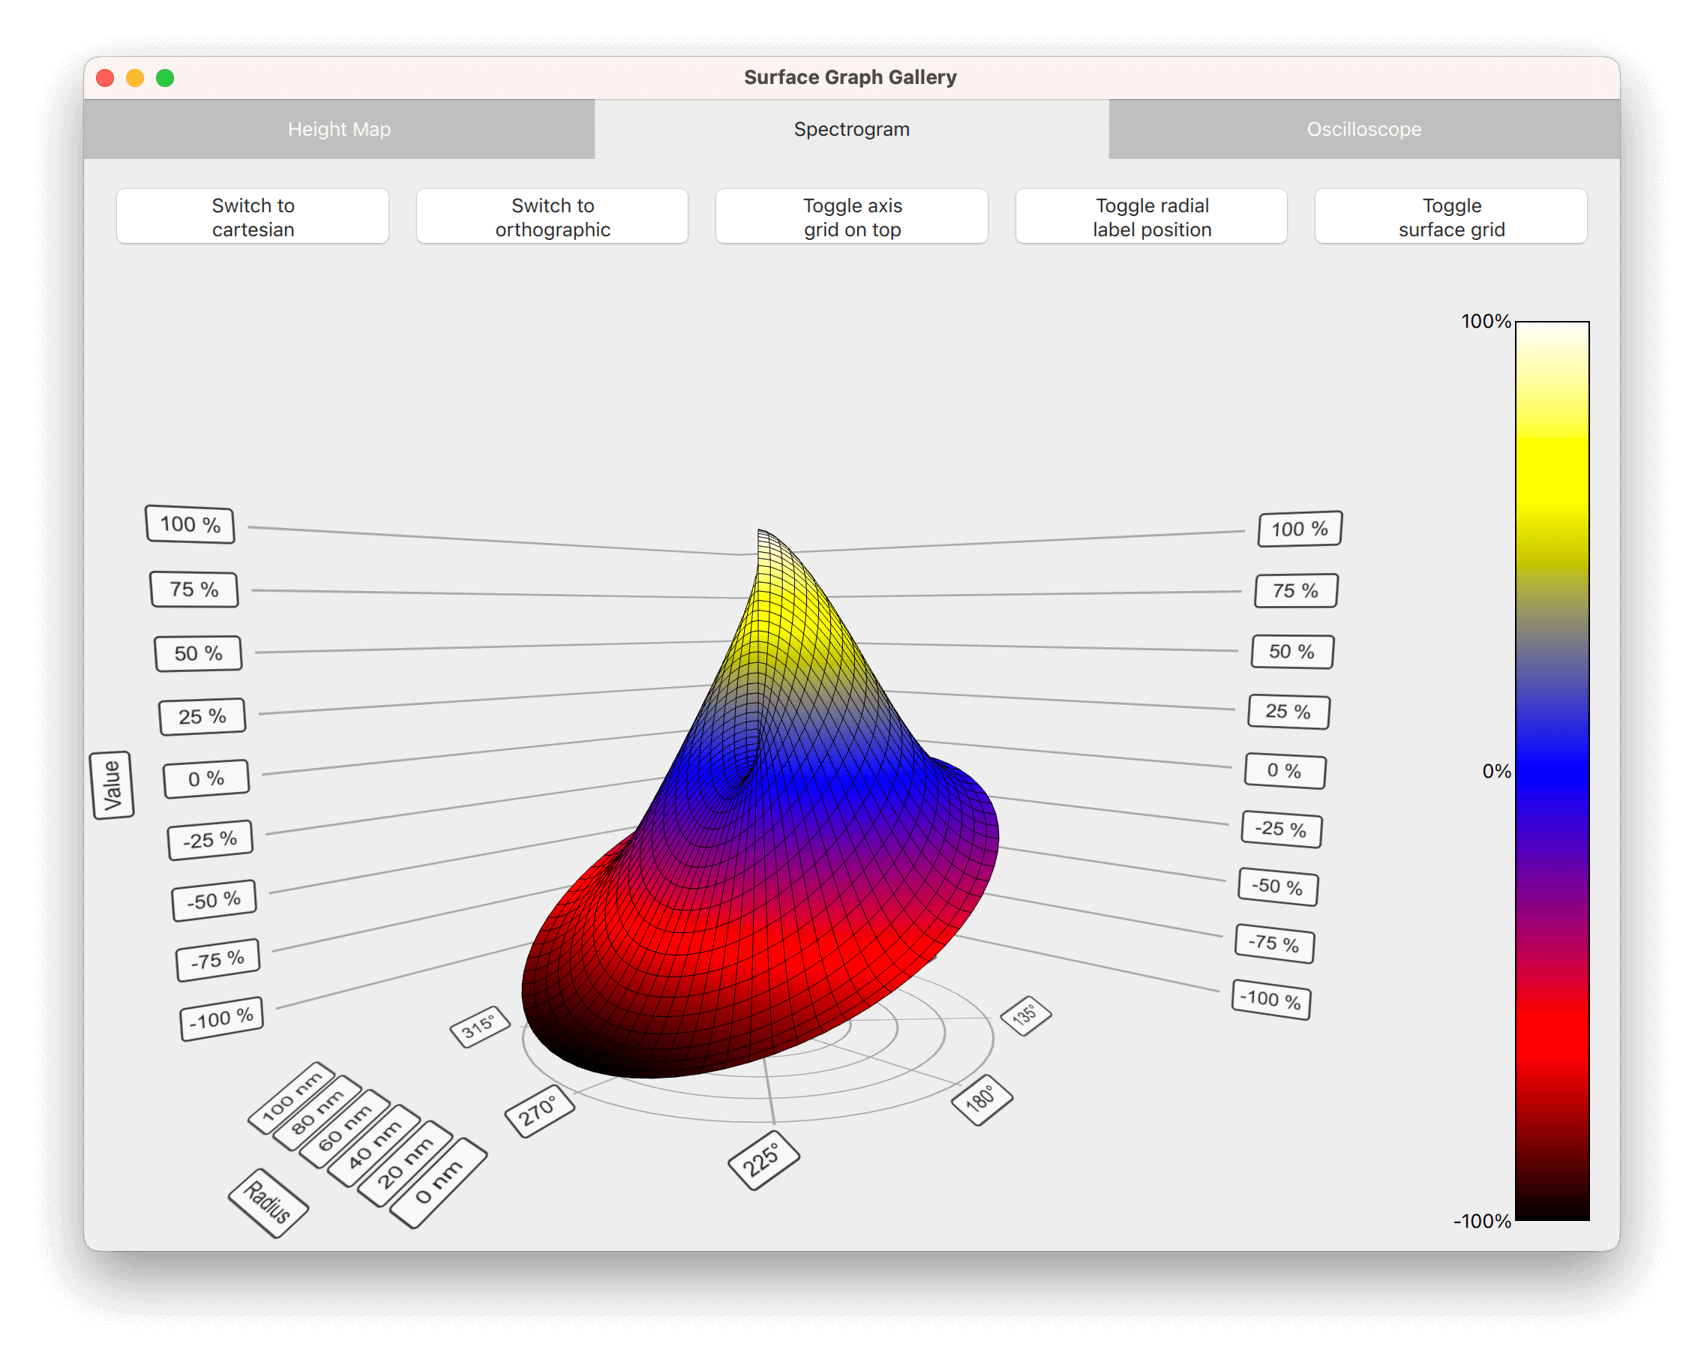
Spectrogram
In the Spectrogram tab, display polar and cartesian spectrograms and use orthographic projection to show them in 2D.
A spectrogram is a surface graph with a range gradient used to emphasize the different values. Typically, spectrograms are shown with two-dimensional surfaces, which is simulated with a top-down orthographic view of the graph. To enforce the 2D effect, disable the graph rotation via mouse or touch when in the orthographic mode.
Creating a Spectrogram
To create a 2D spectrogram, define a Surface3D item with the data given in the Surface3DSeries with an ItemModelSurfaceDataProxy:
Surface3D {
    id: surfaceGraph
    anchors.fill: parent

    Surface3DSeries {
        id: surfaceSeries
        flatShadingEnabled: false
        drawMode: Surface3DSeries.DrawSurface
        baseGradient: surfaceGradient
        colorStyle: Theme3D.ColorStyleRangeGradient
        itemLabelFormat: "(@xLabel, @zLabel): @yLabel"

        ItemModelSurfaceDataProxy {
            itemModel: surfaceData.model
            rowRole: "radius"
            columnRole: "angle"
            yPosRole: "value"
        }
    }
The key properties for enabling the 2D effect are orthoProjection and scene.activeCamera.cameraPreset. Remove the perspective by enabling orthographic projection for the graph, and the Y-dimension by viewing the graph directly from above:
// Remove the perspective and view the graph from top down to achieve 2D effect
orthoProjection: true
scene.activeCamera.cameraPreset: Camera3D.CameraPresetDirectlyAbove
Since this viewpoint causes the horizontal axis grid to be mostly obscured by the surface, flip the horizontal grid to be drawn on top of the graph:
flipHorizontalGrid: true
Polar Spectrogram
Depending on the data, it is sometimes more natural to use a polar graph instead of a cartesian one. This is supported via the polar property.
Add a button to switch between polar and cartesian modes:
Button {
    id: polarToggle
    anchors.margins: 5
    anchors.left: parent.left
    anchors.top: parent.top
    width: spectrogramView.buttonWidth // Calculated elsewhere based on screen orientation
    text: "Switch to\n" + (surfaceGraph.polar ? "cartesian" : "polar")
    onClicked: surfaceGraph.polar = !surfaceGraph.polar;
}
In the polar mode, X-axis is converted into the angular polar axis, and Z-axis is converted into a radial polar axis. The surface points are recalculated according to the new axes.
The radial axis labels are drawn outside the graph by default. To draw them right next to the 0 degree angular axis inside the graph, define only a small offset for them:
radialLabelOffset: 0.01
To enforce the 2D effect, disable graph rotation in orthographic mode by overriding the default input handler with a custom one, which automatically toggles the rotationEnabled property based on the projection mode:
inputHandler: TouchInputHandler3D {
    rotationEnabled: !surfaceGraph.orthoProjection
}
Oscilloscope
In the Oscilloscope tab, combine C++ and QML in an application, and show data that dynamically changes.
Data Source in C++
The item model based proxies are good for simple or static graphs, but use basic proxies to achieve the best performance when displaying data changing in realtime. These are not supported in QML, as the data items they store do not inherit QObject and cannot therefore be directly manipulated from QML code. To overcome this limitation, implement a simple DataSource class in C++ to populate the data proxy of the series.
Create a DataSource class to provide two methods that can be invoked from QML:
class DataSource : public QObject
{
    Q_OBJECT
    ...
Q_INVOKABLE void generateData(int cacheCount, int rowCount, int columnCount,
                              float xMin, float xMax,
                              float yMin, float yMax,
                              float zMin, float zMax);

Q_INVOKABLE void update(QSurface3DSeries *series);
The first method, generateData(), creates a cache of simulated oscilloscope data to display. The data is cached in a format that QSurfaceDataProxy accepts:
// Populate caches
auto *generator = QRandomGenerator::global();
for (int i = 0; i < cacheCount; ++i) {
    QSurfaceDataArray &cache = m_data[i];
    float cacheXAdjustment = cacheStep * i;
    float cacheIndexAdjustment = cacheIndexStep * i;
    for (int j = 0; j < rowCount; ++j) {
        QSurfaceDataRow &row = *(cache[j]);
        float rowMod = (float(j)) / float(rowCount);
        float yRangeMod = yRange * rowMod;
        float zRangeMod = zRange * rowMod;
        float z = zRangeMod + zMin;
        qreal rowColWaveAngleMul = M_PI * M_PI * rowMod;
        float rowColWaveMul = yRangeMod * 0.2f;
        for (int k = 0; k < columnCount; k++) {
            float colMod = (float(k)) / float(columnCount);
            float xRangeMod = xRange * colMod;
            float x = xRangeMod + xMin + cacheXAdjustment;
            float colWave = float(qSin((2.0 * M_PI * colMod) - (1.0 / 2.0 * M_PI)) + 1.0);
            float y = (colWave * ((float(qSin(rowColWaveAngleMul * colMod) + 1.0))))
                    * rowColWaveMul
                    + generator->bounded(0.15f) * yRangeMod;

            int index = k + cacheIndexAdjustment;
            if (index >= columnCount) {
                // Wrap over
                index -= columnCount;
                x -= xRange;
            }
            row[index] = QVector3D(x, y, z);
        }
    }
}
The second method, update(), copies one set of the cached data into another array, which is set to the data proxy of the series by calling QSurfaceDataProxy::resetArray(). To minimize overhead, reuse the same array if the array dimensions have not changed:
// Each iteration uses data from a different cached array
if (++m_index >= m_data.size())
    m_index = 0;

const QSurfaceDataArray &array = m_data.at(m_index);
int newRowCount = array.size();
int newColumnCount = array.at(0)->size();

// If the first time or the dimensions of the cache array have changed,
// reconstruct the reset array
if (!m_resetArray || series->dataProxy()->rowCount() != newRowCount
        || series->dataProxy()->columnCount() != newColumnCount) {
    m_resetArray = new QSurfaceDataArray();
    m_resetArray->reserve(newRowCount);
    for (int i = 0; i < newRowCount; ++i)
        m_resetArray->append(new QSurfaceDataRow(newColumnCount));
}

// Copy items from our cache to the reset array
for (int i = 0; i < newRowCount; ++i) {
    const QSurfaceDataRow &sourceRow = *(array.at(i));
    QSurfaceDataRow &row = *(*m_resetArray)[i];
    std::copy(sourceRow.cbegin(), sourceRow.cend(), row.begin());
}

// Notify the proxy that data has changed
series->dataProxy()->resetArray(m_resetArray);
Even though we are operating on the array pointer previously set to the proxy, QSurfaceDataProxy::resetArray() still needs to be called after changing the data in it to prompt the graph to render the data.
To be able to access the DataSource methods from QML, expose the data source by making the DataSource a QML_ELEMENT:
class DataSource : public QObject
{
    Q_OBJECT
    QML_ELEMENT
Further, declare it as a QML module in the CMakeLists.txt:
qt6_add_qml_module(qmlsurfacegallery
    URI SurfaceGallery
    VERSION 1.0
    NO_RESOURCE_TARGET_PATH
    SOURCES
        datasource.cpp datasource.h
    ...
)
To use QSurface3DSeries pointers as parameters for the DataSource class methods on all environments and builds, make sure the meta type is registered:
qRegisterMetaType<QSurface3DSeries *>();
QML Application
To use the DataSource, import the QML module and create an instance of DataSource to be used:
import SurfaceGallery
...
DataSource {
    id: dataSource
}
Define a Surface3D graph and give it a Surface3DSeries:
Surface3D {
    id: surfaceGraph
    anchors.fill: parent

    Surface3DSeries {
        id: surfaceSeries
        drawMode: Surface3DSeries.DrawSurfaceAndWireframe
        itemLabelFormat: "@xLabel, @zLabel: @yLabel"
Don't specify a proxy for the Surface3DSeries that you attach to the graph. This makes the series utilize the default QSurfaceDataProxy.
Hide the item label with itemLabelVisible. With dynamic, fast-changing data, a floating selection label would be distracting and difficult to read.
itemLabelVisible: false
You can display the selected item information in a Text element instead of the default floating label above the selection pointer:
onItemLabelChanged: {
    if (surfaceSeries.selectedPoint == surfaceSeries.invalidSelectionPosition)
        selectionText.text = "No selection";
    else
        selectionText.text = surfaceSeries.itemLabel;
}
Initialize the DataSource cache when the graph is complete by calling a helper function generateData(), which calls the method with the same name in DataSource:
Component.onCompleted: oscilloscopeView.generateData();
...
function generateData() {
    dataSource.generateData(oscilloscopeView.sampleCache, oscilloscopeView.sampleRows,
                            oscilloscopeView.sampleColumns,
                            surfaceGraph.axisX.min, surfaceGraph.axisX.max,
                            surfaceGraph.axisY.min, surfaceGraph.axisY.max,
                            surfaceGraph.axisZ.min, surfaceGraph.axisZ.max);
}
To trigger the updates in data, define a Timer, which calls the update() method in DataSource at requested intervals:
Timer {
    id: refreshTimer
    interval: 1000 / frequencySlider.value
    running: true
    repeat: true
    onTriggered: dataSource.update(surfaceSeries);
}
Enabling Direct Rendering
Since this application potentially deals with a lot of rapidly changing data, it uses direct rendering mode for performance. To enable antialiasing in this mode, change the surface format of the application window. The default format used by QQuickView doesn't support antialiasing. Use the utility function provided to change the surface format in main.cpp:
#include <QtDataVisualization/qutils.h>
...
// Enable antialiasing in direct rendering mode
viewer.setFormat(qDefaultSurfaceFormat(true));
Example Contents
© 2026 The Qt Company Ltd. Documentation contributions included herein are the copyrights of their respective owners. The documentation provided herein is licensed under the terms of the GNU Free Documentation License version 1.3 as published by the Free Software Foundation. Qt and respective logos are trademarks of The Qt Company Ltd. in Finland and/or other countries worldwide. All other trademarks are property of their respective owners.
