
Previous topic
Next topic
QAreaSeries
The QAreaSeries class presents data in area charts. More…
Synopsis
Functions
def
borderColor()def
brush()def
color()def
lowerSeries()def
pen()def
pointLabelsClipping()def
pointLabelsColor()def
pointLabelsFont()def
pointLabelsFormat()def
pointLabelsVisible()def
pointsVisible()def
setBorderColor(color)def
setBrush(brush)def
setColor(color)def
setLowerSeries(series)def
setPen(pen)def
setPointLabelsClipping([enabled=true])def
setPointLabelsColor(color)def
setPointLabelsFont(font)def
setPointLabelsFormat(format)def
setPointLabelsVisible([visible=true])def
setPointsVisible([visible=true])def
setUpperSeries(series)def
upperSeries()
Signals
def
borderColorChanged(color)def
clicked(point)def
colorChanged(color)def
doubleClicked(point)def
hovered(point, state)def
pointLabelsClippingChanged(clipping)def
pointLabelsColorChanged(color)def
pointLabelsFontChanged(font)def
pointLabelsFormatChanged(format)def
pointLabelsVisibilityChanged(visible)def
pressed(point)def
released(point)def
selected()
Detailed Description
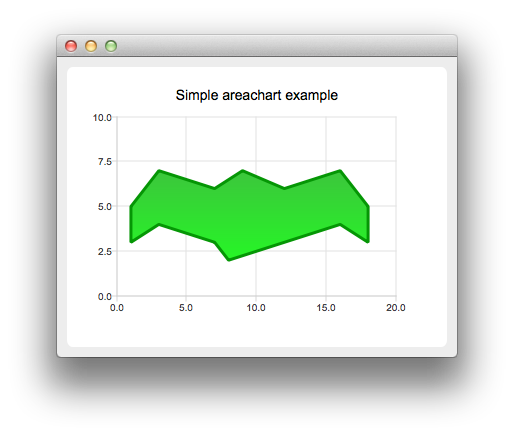
An area series is used to show quantitative data. It is based on a line series, in the way that the area between the boundary lines is emphasized with color. Since the area series is based on the line series, the QAreaSeries constructor needs a QLineSeries instance, which defines the upper boundary of the area. The area chart is drawn using the bottom of the plot area as the lower boundary by default. Instead of the bottom of the plot area, the lower boundary can be specified by another line. In that case, QAreaSeries should be initialized with two QLineSeries instances.
Note
The terms upper and lower boundary can be misleading in cases where the value of the lower boundary is greater than that of the upper boundary. The main point is that the area between these two boundary lines will be filled.
See the area chart example to learn how to create a simple area chart.
- class PySide6.QtCharts.QAreaSeries(upperSeries[, lowerSeries=None])
PySide6.QtCharts.QAreaSeries([parent=None])
- Parameters
upperSeries –
PySide6.QtCharts.QLineSerieslowerSeries –
PySide6.QtCharts.QLineSeriesparent –
PySide6.QtCore.QObject
Constructs an area series object that will be spanned between an upperSeries line and a lowerSeries line. If no lowerSeries is passed to the constructor, the x-axis is used as the lower bound instead.
The QAreaSeries does not own the upper or lower series, but the ownership stays with the caller. When the series object is added to QChartView or QChart , the instance ownership is transferred.
Constructs an area series object without an upper or a lower series with the parent object.
- PySide6.QtCharts.QAreaSeries.borderColor()
- Return type
This property holds The line (pen) color of the series. This is a convenience property for modifying the color of the pen..
See also
- PySide6.QtCharts.QAreaSeries.borderColorChanged(color)
- Parameters
color –
PySide6.QtGui.QColor
- PySide6.QtCharts.QAreaSeries.brush()
- Return type
Returns the brush used to draw the line for this series.
See also
- PySide6.QtCharts.QAreaSeries.clicked(point)
- Parameters
point –
PySide6.QtCore.QPointF
- PySide6.QtCharts.QAreaSeries.color()
- Return type
This property holds The fill (brush) color of the series. This is a convenience property for modifying the color of the brush..
See also
- PySide6.QtCharts.QAreaSeries.colorChanged(color)
- Parameters
color –
PySide6.QtGui.QColor
- PySide6.QtCharts.QAreaSeries.doubleClicked(point)
- Parameters
point –
PySide6.QtCore.QPointF
- PySide6.QtCharts.QAreaSeries.hovered(point, state)
- Parameters
point –
PySide6.QtCore.QPointFstate – bool
- PySide6.QtCharts.QAreaSeries.lowerSeries()
- Return type
This property holds The lower one of the two line series used to define area series boundaries..
Note
If QAreaSeries was constructed without a , this is null.
- PySide6.QtCharts.QAreaSeries.pen()
- Return type
Returns the pen used to draw the line for this series.
See also
- PySide6.QtCharts.QAreaSeries.pointLabelsClipping()
- Return type
bool
This property holds The clipping for data point labels. True by default. The labels on the edge of the plot area are cut when clipping is enabled..
See also
- PySide6.QtCharts.QAreaSeries.pointLabelsClippingChanged(clipping)
- Parameters
clipping – bool
- PySide6.QtCharts.QAreaSeries.pointLabelsColor()
- Return type
This property holds The color used for data point labels. By default, the color is the color of the brush defined for labels in the theme..
See also
- PySide6.QtCharts.QAreaSeries.pointLabelsColorChanged(color)
- Parameters
color –
PySide6.QtGui.QColor
- PySide6.QtCharts.QAreaSeries.pointLabelsFont()
- Return type
This property holds The font used for data point labels..
See also
- PySide6.QtCharts.QAreaSeries.pointLabelsFontChanged(font)
- Parameters
font –
PySide6.QtGui.QFont
- PySide6.QtCharts.QAreaSeries.pointLabelsFormat()
- Return type
str
This property holds The format used for showing labels with series points..
QAreaSeries supports the following format tags:
@xPoint
The x value of the data point
@yPoint
The y value of the data point
For example, the following usage of the format tags would produce labels that have the data point (x, y) shown inside brackets separated by a comma:
series->setPointLabelsFormat("(@xPoint, @yPoint)");
By default, the label format is set to @xPoint, @yPoint. The labels are shown on the plot area, whereas labels on the edge of the plot area are cut. If the points are close to each other, the labels may overlap.
- PySide6.QtCharts.QAreaSeries.pointLabelsFormatChanged(format)
- Parameters
format – str
- PySide6.QtCharts.QAreaSeries.pointLabelsVisibilityChanged(visible)
- Parameters
visible – bool
- PySide6.QtCharts.QAreaSeries.pointLabelsVisible()
- Return type
bool
This property holds The visibility of data point labels. False by default..
See also
- PySide6.QtCharts.QAreaSeries.pointsVisible()
- Return type
bool
Returns whether the points are drawn for this series.
See also
- PySide6.QtCharts.QAreaSeries.pressed(point)
- Parameters
point –
PySide6.QtCore.QPointF
- PySide6.QtCharts.QAreaSeries.released(point)
- Parameters
point –
PySide6.QtCore.QPointF
- PySide6.QtCharts.QAreaSeries.selected()
- PySide6.QtCharts.QAreaSeries.setBorderColor(color)
- Parameters
color –
PySide6.QtGui.QColor
This property holds The line (pen) color of the series. This is a convenience property for modifying the color of the pen..
See also
- PySide6.QtCharts.QAreaSeries.setBrush(brush)
- Parameters
brush –
PySide6.QtGui.QBrush
Sets the brush used for filling the area.
See also
- PySide6.QtCharts.QAreaSeries.setColor(color)
- Parameters
color –
PySide6.QtGui.QColor
This property holds The fill (brush) color of the series. This is a convenience property for modifying the color of the brush..
See also
- PySide6.QtCharts.QAreaSeries.setLowerSeries(series)
- Parameters
series –
PySide6.QtCharts.QLineSeries
Sets the series that is to be used as the area chart lower series.
See also
- PySide6.QtCharts.QAreaSeries.setPen(pen)
- Parameters
pen –
PySide6.QtGui.QPen
Sets the pen used for drawing the area outline.
See also
- PySide6.QtCharts.QAreaSeries.setPointLabelsClipping([enabled=true])
- Parameters
enabled – bool
This property holds The clipping for data point labels. True by default. The labels on the edge of the plot area are cut when clipping is enabled..
See also
- PySide6.QtCharts.QAreaSeries.setPointLabelsColor(color)
- Parameters
color –
PySide6.QtGui.QColor
This property holds The color used for data point labels. By default, the color is the color of the brush defined for labels in the theme..
See also
- PySide6.QtCharts.QAreaSeries.setPointLabelsFont(font)
- Parameters
font –
PySide6.QtGui.QFont
This property holds The font used for data point labels..
See also
- PySide6.QtCharts.QAreaSeries.setPointLabelsFormat(format)
- Parameters
format – str
This property holds The format used for showing labels with series points..
QAreaSeries supports the following format tags:
@xPoint
The x value of the data point
@yPoint
The y value of the data point
For example, the following usage of the format tags would produce labels that have the data point (x, y) shown inside brackets separated by a comma:
series->setPointLabelsFormat("(@xPoint, @yPoint)");
By default, the label format is set to @xPoint, @yPoint. The labels are shown on the plot area, whereas labels on the edge of the plot area are cut. If the points are close to each other, the labels may overlap.
- PySide6.QtCharts.QAreaSeries.setPointLabelsVisible([visible=true])
- Parameters
visible – bool
This property holds The visibility of data point labels. False by default..
See also
- PySide6.QtCharts.QAreaSeries.setPointsVisible([visible=true])
- Parameters
visible – bool
Determines whether data points are visible and should be drawn on the line.
See also
- PySide6.QtCharts.QAreaSeries.setUpperSeries(series)
- Parameters
series –
PySide6.QtCharts.QLineSeries
Sets the series that is to be used as the area chart upper series. If the upper series is null, the area chart is not drawn, even if it has a lower series.
See also
- PySide6.QtCharts.QAreaSeries.upperSeries()
- Return type
This property holds The upper one of the two line series used to define area series boundaries..
© 2022 The Qt Company Ltd. Documentation contributions included herein are the copyrights of their respective owners. The documentation provided herein is licensed under the terms of the GNU Free Documentation License version 1.3 as published by the Free Software Foundation. Qt and respective logos are trademarks of The Qt Company Ltd. in Finland and/or other countries worldwide. All other trademarks are property of their respective owners.