QLegend
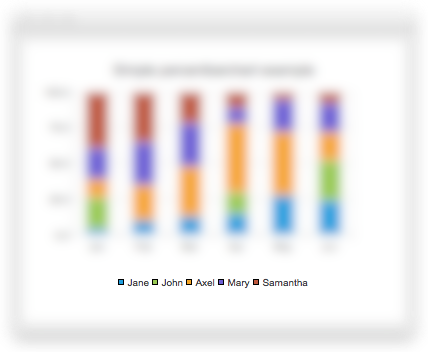
The QLegend class displays the legend of a chart. More…
Synopsis
Functions
def
alignment()def
attachToChart()def
borderColor()def
brush()def
color()def
detachFromChart()def
isAttachedToChart()def
isBackgroundVisible()def
isInteractive()def
labelBrush()def
labelColor()def
markerShape()def
markers([series=None])def
pen()def
reverseMarkers()def
setAlignment(alignment)def
setBackgroundVisible([visible=true])def
setBorderColor(color)def
setBrush(brush)def
setColor(color)def
setInteractive(interactive)def
setLabelBrush(brush)def
setLabelColor(color)def
setMarkerShape(shape)def
setPen(pen)def
setReverseMarkers([reverseMarkers=true])def
setShowToolTips(show)def
showToolTips()
Signals
def
attachedToChartChanged(attachedToChart)def
backgroundVisibleChanged(visible)def
borderColorChanged(color)def
colorChanged(color)def
fontChanged(font)def
interactiveChanged(interactive)def
labelColorChanged(color)def
markerShapeChanged(shape)def
reverseMarkersChanged(reverseMarkers)def
showToolTipsChanged(showToolTips)
Detailed Description
A legend is a graphical object that displays the legend of a chart. The legend state is updated by QChart when series change. By default, the legend is attached to the chart, but it can be detached to make it independent of chart layout. Legend objects cannot be created or deleted, but they can be referenced via the QChart class.

See also
- class PySide6.QtCharts.QLegend
- PySide6.QtCharts.QLegend.MarkerShape
This enum describes the shape used when rendering legend marker items.
Constant
Description
QLegend.MarkerShapeDefault
Default shape determined by
QLegendis used for the marker. This value is supported only for individualQLegendMarkeritems.QLegend.MarkerShapeRectangle
Rectangular markers are used. Marker size is determined by font size.
QLegend.MarkerShapeCircle
Circular markers are used. Marker size is determined by font size.
QLegend.MarkerShapeRotatedRectangle
Rotated rectangle shaped markers are used. Marker size is determined by font size.
QLegend.MarkerShapeTriangle
Triangular markers are used. Marker size is determined by font size.
QLegend.MarkerShapeStar
Star shaped markers are used. Marker size is determined by font size.
QLegend.MarkerShapePentagon
Pentagon shaped markers are used. Marker size is determined by font size.
QLegend.MarkerShapeFromSeries
The marker shape is determined by the series. In case of a scatter series, the legend marker looks like a scatter dot and is the same size as the dot. In case of a line or spline series, the legend marker looks like a small segment of the line. For other series types, rectangular markers are shown. If a
lightMarkeris specified for a series, thelightMarkerwill be shown and its size will be determined by the series marker size.See also
- PySide6.QtCharts.QLegend.alignment()
- Return type
Alignment
This property holds How the legend is aligned with the chart..
Can be AlignTop , AlignBottom , AlignLeft , AlignRight . If you set more than one flag, the result is undefined.
- PySide6.QtCharts.QLegend.attachToChart()
Attaches the legend to a chart. The chart may adjust the layout of the legend.
- PySide6.QtCharts.QLegend.attachedToChartChanged(attachedToChart)
- Parameters
attachedToChart – bool
- PySide6.QtCharts.QLegend.backgroundVisibleChanged(visible)
- Parameters
visible – bool
- PySide6.QtCharts.QLegend.borderColor()
- Return type
This property holds The line color of the legend..
- PySide6.QtCharts.QLegend.borderColorChanged(color)
- Parameters
color –
PySide6.QtGui.QColor
- PySide6.QtCharts.QLegend.brush()
- Return type
Returns the brush used by the legend.
See also
- PySide6.QtCharts.QLegend.color()
- Return type
This property holds The background (brush) color of the legend..
If you change the color of the legend, the style of the legend brush is set to SolidPattern .
- PySide6.QtCharts.QLegend.colorChanged(color)
- Parameters
color –
PySide6.QtGui.QColor
- PySide6.QtCharts.QLegend.detachFromChart()
Detaches the legend from the chart. The chart will no longer adjust the layout of the legend.
- PySide6.QtCharts.QLegend.fontChanged(font)
- Parameters
font –
PySide6.QtGui.QFont
- PySide6.QtCharts.QLegend.interactiveChanged(interactive)
- Parameters
interactive – bool
- PySide6.QtCharts.QLegend.isAttachedToChart()
- Return type
bool
Returns true, if the legend is attached to a chart.
- PySide6.QtCharts.QLegend.isBackgroundVisible()
- Return type
bool
This property holds Whether the legend background is visible..
- PySide6.QtCharts.QLegend.isInteractive()
- Return type
bool
Returns whether the legend can be dragged or resized using a mouse when it is detached.
See also
- PySide6.QtCharts.QLegend.labelBrush()
- Return type
Returns the brush used to draw labels.
See also
- PySide6.QtCharts.QLegend.labelColor()
- Return type
This property holds The color of the brush used to draw labels..
- PySide6.QtCharts.QLegend.labelColorChanged(color)
- Parameters
color –
PySide6.QtGui.QColor
- PySide6.QtCharts.QLegend.markerShape()
- Return type
The default shape of the legend markers. The default value is MarkerShapeRectangle.
- PySide6.QtCharts.QLegend.markerShapeChanged(shape)
- Parameters
shape –
MarkerShape
- PySide6.QtCharts.QLegend.markers([series=None])
- Parameters
series –
PySide6.QtCharts.QAbstractSeries- Return type
Returns the list of markers in the legend. The list can be filtered by specifying the series for which the markers are returned.
- PySide6.QtCharts.QLegend.pen()
- Return type
Returns the pen used by the legend.
See also
- PySide6.QtCharts.QLegend.reverseMarkers()
- Return type
bool
This property holds Whether reverse order is used for the markers in the legend..
This property is false by default.
- PySide6.QtCharts.QLegend.reverseMarkersChanged(reverseMarkers)
- Parameters
reverseMarkers – bool
- PySide6.QtCharts.QLegend.setAlignment(alignment)
- Parameters
alignment –
Alignment
This property holds How the legend is aligned with the chart..
Can be AlignTop , AlignBottom , AlignLeft , AlignRight . If you set more than one flag, the result is undefined.
- PySide6.QtCharts.QLegend.setBackgroundVisible([visible=true])
- Parameters
visible – bool
This property holds Whether the legend background is visible..
- PySide6.QtCharts.QLegend.setBorderColor(color)
- Parameters
color –
PySide6.QtGui.QColor
This property holds The line color of the legend..
- PySide6.QtCharts.QLegend.setBrush(brush)
- Parameters
brush –
PySide6.QtGui.QBrush
Sets the brush that is used to draw the background of the legend.
See also
- PySide6.QtCharts.QLegend.setColor(color)
- Parameters
color –
PySide6.QtGui.QColor
This property holds The background (brush) color of the legend..
If you change the color of the legend, the style of the legend brush is set to SolidPattern .
- PySide6.QtCharts.QLegend.setInteractive(interactive)
- Parameters
interactive – bool
When interactive is true and the legend is detached, the legend is able to be moved and resized with a mouse in a similar way to a window.
The legend will automatically attach to an edge of the chart by dragging it off of that edge. Double clicking an attached legend will detach it. This is false by default.
See also
- PySide6.QtCharts.QLegend.setLabelBrush(brush)
- Parameters
brush –
PySide6.QtGui.QBrush
Sets the brush used to draw the legend labels to brush.
See also
- PySide6.QtCharts.QLegend.setLabelColor(color)
- Parameters
color –
PySide6.QtGui.QColor
This property holds The color of the brush used to draw labels..
- PySide6.QtCharts.QLegend.setMarkerShape(shape)
- Parameters
shape –
MarkerShape
The default shape of the legend markers. The default value is MarkerShapeRectangle.
- PySide6.QtCharts.QLegend.setPen(pen)
- Parameters
pen –
PySide6.QtGui.QPen
Sets the pen that is used to draw the legend borders.
See also
- PySide6.QtCharts.QLegend.setReverseMarkers([reverseMarkers=true])
- Parameters
reverseMarkers – bool
This property holds Whether reverse order is used for the markers in the legend..
This property is false by default.
- PySide6.QtCharts.QLegend.setShowToolTips(show)
- Parameters
show – bool
This property holds Whether tooltips are shown when the text is truncated..
This property is false by default.
- PySide6.QtCharts.QLegend.showToolTips()
- Return type
bool
This property holds Whether tooltips are shown when the text is truncated..
This property is false by default.
- PySide6.QtCharts.QLegend.showToolTipsChanged(showToolTips)
- Parameters
showToolTips – bool
© 2022 The Qt Company Ltd. Documentation contributions included herein are the copyrights of their respective owners. The documentation provided herein is licensed under the terms of the GNU Free Documentation License version 1.3 as published by the Free Software Foundation. Qt and respective logos are trademarks of The Qt Company Ltd. in Finland and/or other countries worldwide. All other trademarks are property of their respective owners.
