
Previous topic
Next topic
QPolarChart
The QPolarChart presents data in polar charts. More…
Synopsis
Functions
def
addAxis(axis, polarOrientation)
Static functions
def
axisPolarOrientation(axis)
Detailed Description
Polar charts present data in a circular graph, where the placement of data is based on the angle and distance from the center of the graph, the pole.
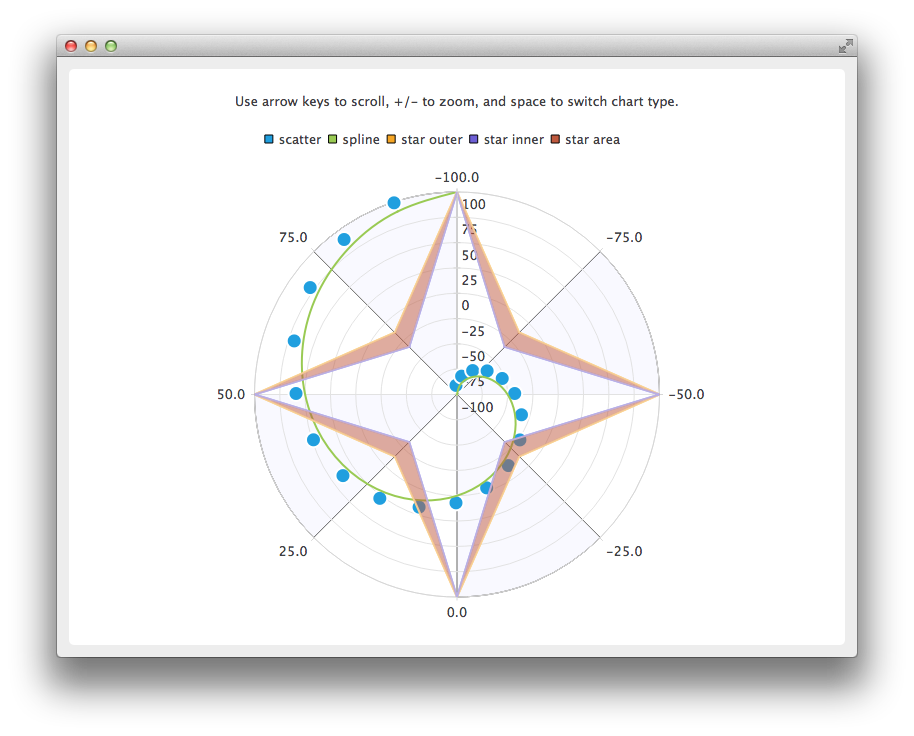
A polar chart is a specialization of QChart that supports line, spline, area, and scatter series, and all axis types supported by them. Each axis can be used either as a radial or an angular axis.
The first and last tick mark on an angular QValueAxis are co-located at a 0/360 degree angle.
If the angular distance between two consecutive points in a series is more than 180 degrees, any direct line connecting the two points becomes meaningless, and will not be drawn. Instead, a line will be drawn to and from the center of the chart. Therefore, the axis ranges must be chosen accordingly when displaying line, spline, or area series.
Polar charts draw all axes of the same orientation in the same position, so using multiple axes of the same orientation can be confusing, unless the extra axes are only used to customize the grid. For example, you can display a highlighted range with a secondary shaded QCategoryAxis or provide unlabeled subticks with a secondary QValueAxis thas has hidden labels.
See also
- class PySide6.QtCharts.QPolarChart([parent=None[, wFlags=Qt.WindowFlags()]])
- Parameters
wFlags –
WindowFlagsparent –
PySide6.QtWidgets.QGraphicsItem
Constructs a polar chart as a child of parent. The properties specified by wFlags are passed to the QChart constructor.
- PySide6.QtCharts.QPolarChart.PolarOrientation
This enum type specifies the polar orientation of an axis.
Constant
Description
QPolarChart.PolarOrientationRadial
A radial axis, where the values are placed along the radius of the chart, starting at the pole.
QPolarChart.PolarOrientationAngular
An angular axis, where the values are placed around the chart.
- PySide6.QtCharts.QPolarChart.addAxis(axis, polarOrientation)
- Parameters
polarOrientation –
PolarOrientation
This convenience method adds the axis axis to the polar chart with the polar orientation polarOrientation. The chart takes the ownership of the axis.
Note
Axes can be added to a polar chart also with addAxis() . The specified alignment determines the polar orientation: horizontal alignments indicate an angular axis and vertical alignments indicate a radial axis.
- static PySide6.QtCharts.QPolarChart.axisPolarOrientation(axis)
- Parameters
- Return type
The angular axes of a polar chart report horizontal orientation and the radial axes report vertical orientation. This function is a convenience function for converting the orientation of the axis axis to the corresponding polar orientation. If the axis is null or not added to a polar chart, the return value is meaningless.
© 2022 The Qt Company Ltd. Documentation contributions included herein are the copyrights of their respective owners. The documentation provided herein is licensed under the terms of the GNU Free Documentation License version 1.3 as published by the Free Software Foundation. Qt and respective logos are trademarks of The Qt Company Ltd. in Finland and/or other countries worldwide. All other trademarks are property of their respective owners.