
Previous topic
Next topic
QScatterSeries
The QScatterSeries class presents data in scatter charts. More…
Synopsis
Functions
def
borderColor()def
markerShape()def
setBorderColor(color)def
setMarkerShape(shape)
Signals
def
borderColorChanged(color)def
markerShapeChanged(shape)
Detailed Description
The scatter data is displayed as a collection of points on the chart. For each point, two values are specified that determine its position on the horizontal axis and the vertical axis.
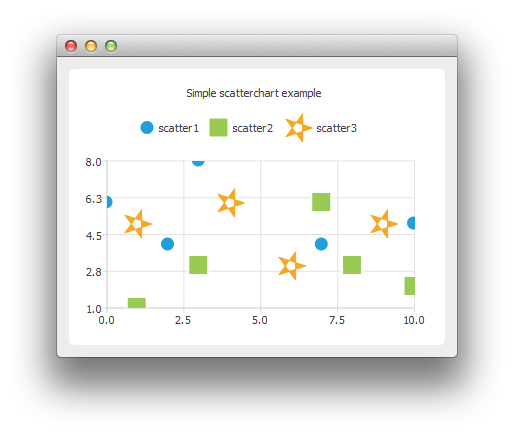
The following code snippet illustrates how to create a basic scatter chart:
QScatterSeries* series = new QScatterSeries();
series->append(0, 6);
series->append(2, 4);
...
chart->addSeries(series);
For more information, see ScatterChart Example and Scatter Interactions Example .
- class PySide6.QtCharts.QScatterSeries([parent=None])
- Parameters
parent –
PySide6.QtCore.QObject
Constructs a series object that is a child of parent.
- PySide6.QtCharts.QScatterSeries.MarkerShape
This enum value describes the shape used when rendering marker items.
Constant
Description
QScatterSeries.MarkerShapeCircle
The marker is a circle. This is the default value.
QScatterSeries.MarkerShapeRectangle
The marker is a rectangle.
QScatterSeries.MarkerShapeRotatedRectangle
The marker is a rotated rectangle.
QScatterSeries.MarkerShapeTriangle
The marker is a triangle.
QScatterSeries.MarkerShapeStar
The marker is a star.
QScatterSeries.MarkerShapePentagon
The marker is a pentagon.
- PySide6.QtCharts.QScatterSeries.borderColor()
- Return type
This property holds The color used to draw the marker borders..
This is a convenience property for modifying the color of the pen.
See also
pen()
- PySide6.QtCharts.QScatterSeries.borderColorChanged(color)
- Parameters
color –
PySide6.QtGui.QColor
- PySide6.QtCharts.QScatterSeries.markerShape()
- Return type
This property holds The shape of the marker used to render the points in the series..
The default shape is MarkerShapeCircle .
See also
MarkerShape
- PySide6.QtCharts.QScatterSeries.markerShapeChanged(shape)
- Parameters
shape –
MarkerShape
- PySide6.QtCharts.QScatterSeries.setBorderColor(color)
- Parameters
color –
PySide6.QtGui.QColor
This property holds The color used to draw the marker borders..
This is a convenience property for modifying the color of the pen.
See also
pen()
- PySide6.QtCharts.QScatterSeries.setMarkerShape(shape)
- Parameters
shape –
MarkerShape
This property holds The shape of the marker used to render the points in the series..
The default shape is MarkerShapeCircle .
See also
MarkerShape
© 2022 The Qt Company Ltd. Documentation contributions included herein are the copyrights of their respective owners. The documentation provided herein is licensed under the terms of the GNU Free Documentation License version 1.3 as published by the Free Software Foundation. Qt and respective logos are trademarks of The Qt Company Ltd. in Finland and/or other countries worldwide. All other trademarks are property of their respective owners.