
Previous topic
Next topic
Qml F1 Legends
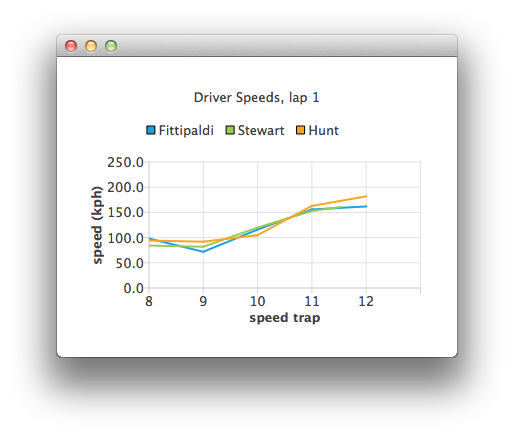
This application demonstrates how to use ListModel as a datasource for a Chart.
Running the Example
To run the example from Qt Creator , open the Welcome mode and select the example from Examples. For more information, visit Building and Running an Example.
Using List Models as Data Sources
Let’s define an empty ChartView first:
ChartView {
    id: chartView
    title: "Driver Speeds, lap 1"
    anchors.fill: parent
    legend.alignment: Qt.AlignTop
    animationOptions: ChartView.SeriesAnimations
    antialiasing: true
}
Our ListModel uses hard-coded test data. In a real application the data source would be a timing system.
ListModel {
    // Hard-coded test data
    ListElement { speedTrap:0; driver: "Fittipaldi"; speed:104.12 }
        ListElement { speedTrap:0; driver:"Stewart"; speed:106.12 }
        ListElement { speedTrap:0; driver:"Hunt"; speed:106.12 }            ...
// An example ListModel containing F1 legend drivers' speeds at speed traps
SpeedsList {
    id: speedsList
    Component.onCompleted: {
        timer.start();
    }
}
The data is parsed with a timer. The line series representing each driver are created on the fly.
// A timer to mimic refreshing the data dynamically
Timer {
    id: timer
    interval: 700
    repeat: true
    triggeredOnStart: true
    running: false
    onTriggered: {
        currentIndex++;
        if (currentIndex < speedsList.count) {
            // Check if there is a series for the data already
            // (we are using driver name to identify series)
            var lineSeries = chartView.series(speedsList.get(currentIndex).driver);
            if (!lineSeries) {
                lineSeries = chartView.createSeries(ChartView.SeriesTypeLine,
                                                    speedsList.get(currentIndex).driver);
                chartView.axisY().min = 0;
                chartView.axisY().max = 250;
                chartView.axisY().tickCount = 6;
                chartView.axisY().titleText = "speed (kph)";
                chartView.axisX().titleText = "speed trap";
                chartView.axisX().labelFormat = "%.0f";
            }
            lineSeries.append(speedsList.get(currentIndex).speedTrap,
                              speedsList.get(currentIndex).speed);

            if (speedsList.get(currentIndex).speedTrap > 3) {
                chartView.axisX().max = Number(speedsList.get(currentIndex).speedTrap) + 1;
                chartView.axisX().min = chartView.axisX().max - 5;
            } else {
                chartView.axisX().max = 5;
                chartView.axisX().min = 0;
            }
            chartView.axisX().tickCount = chartView.axisX().max - chartView.axisX().min + 1;
        } else {
            // No more data, change x-axis range to show all the data
            timer.stop();
            chartView.animationOptions = ChartView.AllAnimations;
            chartView.axisX().min = 0;
            chartView.axisX().max = speedsList.get(currentIndex - 1).speedTrap;
        }
    }
}
© 2022 The Qt Company Ltd. Documentation contributions included herein are the copyrights of their respective owners. The documentation provided herein is licensed under the terms of the GNU Free Documentation License version 1.3 as published by the Free Software Foundation. Qt and respective logos are trademarks of The Qt Company Ltd. in Finland and/or other countries worldwide. All other trademarks are property of their respective owners.