
Previous topic
Next topic
Qml Custom Legend
This example shows you how to create your own custom legend.
This application shows you how to create your own custom legend instead of using the built-in legend of ChartView API.
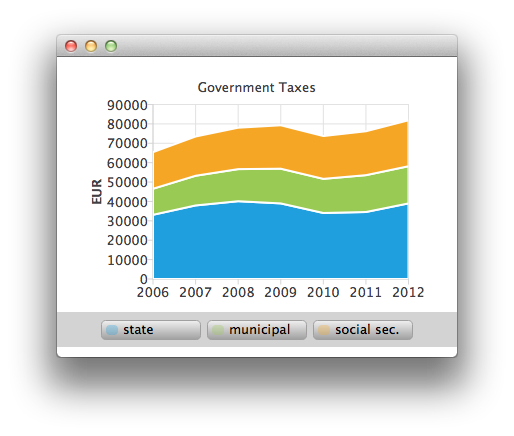
The main view of the application shows a stacked area chart. This is how one of the stacked areas is created. See ChartViewStacked.qml and AnimatedAreaSeries.qml.
Running the Example
To run the example from Qt Creator , open the Welcome mode and select the example from Examples. For more information, visit Building and Running an Example.
Customizing Legends
AnimatedAreaSeries {
    id: municipalSeries
    name: "municipal"
    axisX: axisX
    axisY: axisY
    borderWidth: 0
    upperSeries: LineSeries {
        id: municipalUpper
        XYPoint { x: 2006; y: 33119 + 13443 }
        XYPoint { x: 2007; y: 37941 + 15311 }
        XYPoint { x: 2008; y: 40122 + 16552 }
        XYPoint { x: 2009; y: 38991 + 17904 }
        XYPoint { x: 2010; y: 34055 + 17599 }
        XYPoint { x: 2011; y: 34555 + 19002 }
        XYPoint { x: 2012; y: 38991 + 19177 }
    }
    lowerSeries: stateUpper
}
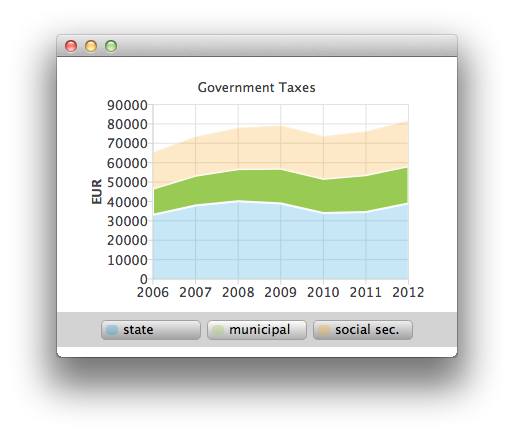
Hovering with mouse on top of the legend will highlight the hovered series. (see CustomLegend.qml).
 Row { id: legendRow anchors.centerIn: parent spacing: 10 Repeater { id: legendRepeater model: seriesCount delegate: legendDelegate } } Component { id: legendDelegate Rectangle { id: rect ... MouseArea { id: mouseArea anchors.fill: parent hoverEnabled: true onEntered: { rect.gradient = buttonGradientHovered; legend.entered(label.text); } onExited: { rect.gradient = buttonGradient; legend.exited(label.text); marker.opacity = 0.3; marker.height = 10; } onClicked: { legend.selected(label.text); marker.opacity = 1.0; marker.height = 12; } }
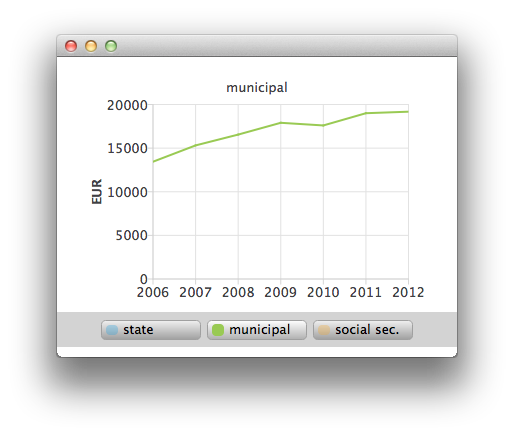
You can also select one of the stacked areas for a closer look as a line series by a mouse click (see ChartViewHighlighted.qml).
 ChartView { id: chartViewHighlighted title: "" property variant selectedSeries signal clicked legend.visible: false margins.top: 10 margins.bottom: 0 antialiasing: true LineSeries { id: lineSeries axisX: ValueAxis { min: 2006 max: 2012 labelFormat: "%.0f" tickCount: 7 } axisY: ValueAxis { id: axisY titleText: "EUR" min: 0 max: 40000 labelFormat: "%.0f" tickCount: 5 } }
© 2022 The Qt Company Ltd. Documentation contributions included herein are the copyrights of their respective owners. The documentation provided herein is licensed under the terms of the GNU Free Documentation License version 1.3 as published by the Free Software Foundation. Qt and respective logos are trademarks of The Qt Company Ltd. in Finland and/or other countries worldwide. All other trademarks are property of their respective owners.