
Previous topic
Next topic
Qml Weather
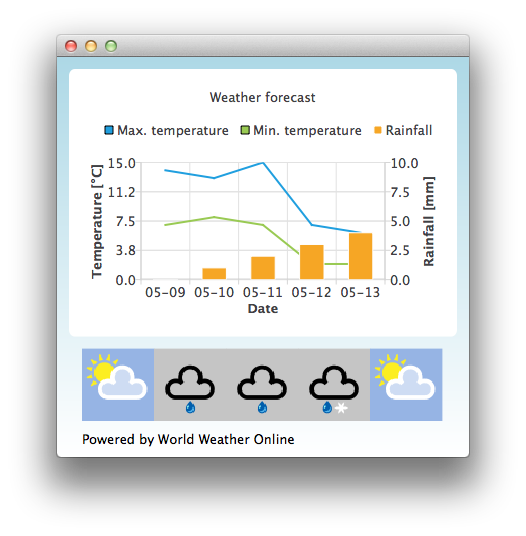
This is a basic demonstration showing how to use the different chart types by using qml.
By default the application uses static test data to mimic a weather forecast. You can also obtain an application id from http://www.worldweatheronline.com/ to get access to weather API provided by World Weather Online. You can then give your application id as a parameter to the Qml Weather executable to make it use live data.
For example:
bin\qmlweather.exe 1234567890abcdef123456
Running the Example
To run the example from Qt Creator , open the Welcome mode and select the example from Examples. For more information, visit Building and Running an Example.
Using Charts in Qt Quick Applications
The example application uses a ChartView and a some series to visualize weather data:
ChartView {
    id: chartView
    title: "Weather forecast"        BarCategoryAxis {
    id: barCategoriesAxis
    titleText: "Date"
}

ValueAxis{
    id: valueAxisY2
    min: 0
    max: 10
    titleText: "Rainfall [mm]"
}

ValueAxis {
    id: valueAxisX
    // Hide the value axis; it is only used to map the line series to bar categories axis
    visible: false
    min: 0
    max: 5
}

ValueAxis{
    id: valueAxisY
    min: 0
    max: 15
    titleText: "Temperature [°C]"
}

LineSeries {
    id: maxTempSeries
    axisX: valueAxisX
    axisY: valueAxisY
    name: "Max. temperature"
}

LineSeries {
    id: minTempSeries
    axisX: valueAxisX
    axisY: valueAxisY
    name: "Min. temperature"
}

BarSeries {
    id: myBarSeries
    axisX: barCategoriesAxis
    axisYRight: valueAxisY2
    BarSet {
        id: rainfallSet
        label: "Rainfall"
    }
}
To get data with weather forecast data, we make an HTTP GET request to World Weather Online. We request the response in JSON data format.
// Make HTTP GET request and parse the result
var xhr = new XMLHttpRequest;
xhr.open("GET",
         "http://free.worldweatheronline.com/feed/weather.ashx?q=Jyv%c3%a4skyl%c3%a4,Finland&format=json&num_of_days=5&key="
         + weatherAppKey);
xhr.onreadystatechange = function() {
    if (xhr.readyState == XMLHttpRequest.DONE) {
        var a = JSON.parse(xhr.responseText);
        parseWeatherData(a);
    }
}
xhr.send();
The JSON response contains an array of forecast data:
// Loop through the parsed JSON
for (var i in weatherData.data.weather) {
    var weatherObj = weatherData.data.weather[i];
That is then used as input data for our series and a ListModel we use as a container for weather icon URLs:
// Store temperature values, rainfall and weather icon.
// The temperature values begin from 0.5 instead of 0.0 to make the start from the
// middle of the rainfall bars. This makes the temperature lines visually better
// synchronized with the rainfall bars.
maxTempSeries.append(Number(i) + 0.5, weatherObj.tempMaxC);
minTempSeries.append(Number(i) + 0.5, weatherObj.tempMinC);
rainfallSet.append(i, weatherObj.precipMM);
weatherImageModel.append({"imageSource":weatherObj.weatherIconUrl[0].value});
© 2022 The Qt Company Ltd. Documentation contributions included herein are the copyrights of their respective owners. The documentation provided herein is licensed under the terms of the GNU Free Documentation License version 1.3 as published by the Free Software Foundation. Qt and respective logos are trademarks of The Qt Company Ltd. in Finland and/or other countries worldwide. All other trademarks are property of their respective owners.