
Previous topic
Next topic
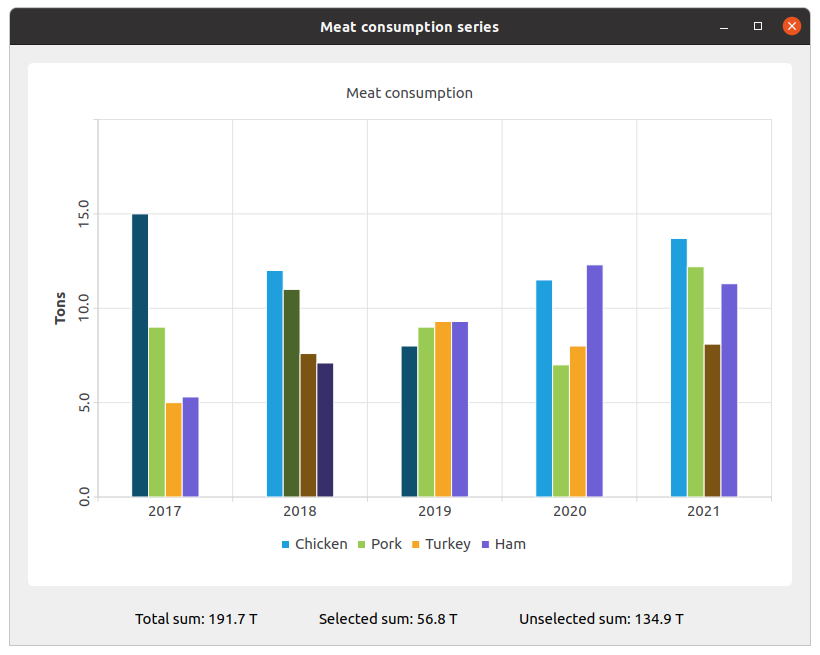
SelectedBar Example
The example shows how to use a selection feature for the bar chart.
The example shows changing the color and state of bars using the selection feature.
Running the Example
To run the example from Qt Creator , open the Welcome mode and select the example from Examples. For more information, visit Building and Running an Example.
Using setBarSelected()
We create the sets and fill them with the data. Then we create a series and append data to it.
setChicken = Utilities::createChickenSet()
setPork = Utilities::createPorkSet()
setTurkey = Utilities::createTurkeySet()
setHam = Utilities::createHamSet()
totalSum = setChicken.sum() + setPork.sum() + setTurkey.sum() + setHam.sum()
QList<QBarSet *> setList = QList<QBarSet *>{setChicken, setPork, setTurkey, setHam}
series = QBarSeries()
series.append(setList)
We create the chart and add series to it. Also, we add a title to the chart, set animation for the chart, and align the legend.
chart = QChart()
chart.addSeries(series)
chart.setTitle(QCoreApplication.tr("Meat consumption"))
chart.setAnimationOptions(QChart.SeriesAnimations)
chart.legend().setVisible(True)
chart.legend().setAlignment(Qt.AlignBottom)
Here we set the color for the selected bars.
for barSet in series.barSets():
    barSet.setSelectedColor(barSet.brush().color().darker())
Next step is adding axes: QBarCategoryAxis for years of measurements and QValueAxis for values range.
categories = Utilities::createYearCategories()
axisX = QBarCategoryAxis()
axisX.setCategories(categories)
chart.addAxis(axisX, Qt.AlignBottom)
series.attachAxis(axisX)
axisY = QValueAxis()
axisY.setRange(0, 20)
axisY.setTitleText(QCoreApplication.tr("Tons"))
axisY.setLabelsAngle(-90)
axisY.setTitleVisible(True)
chart.addAxis(axisY, Qt.AlignLeft)
series.attachAxis(axisY)
Then we add the chart view to put the chart in.
chartView = QChartView(chart)
chartView.setRenderHint(QPainter.Antialiasing)
Here we create a widget for labels of values of selected and unselected bars.
labelWidget = QWidget(mainWindow)
labelLayout = QHBoxLayout(labelWidget)
labelLayout.setAlignment(Qt.AlignCenter)
totalSumLabel = QLabel(QCoreApplication.tr("Total sum: %1 T").arg(totalSum))
labelLayout.addWidget(totalSumLabel)
totalSumLabel.setContentsMargins(0, 0, 54, 0)
selectedSumLabel = QLabel(QCoreApplication.tr("Selected sum: 0 T"))
labelLayout.addWidget(selectedSumLabel)
unselectedSumLabel = QLabel(QCoreApplication.tr("Unselected sum: %1 T").arg(totalSum))
labelLayout.addWidget(unselectedSumLabel)
unselectedSumLabel.setContentsMargins(54, 0, 0, 0)
We connect selecting of a specific bar with labels of values using a lambda. set->toggleSelection({index}) sets the bar selected.
QObject.connect(series, QAbstractBarSeries.clicked, series, [=](int index, QBarSet set) {
    set.toggleSelection({index})
    selectedSum = 0.
    for i in range(0, setList.size()):
        selectedIndices = setList.at(i).selectedBars()
        for k in range(0, selectedIndices.size()):
            selectedSum += setList.at(i).at(selectedIndices.at(k))

    selectedSumLabel.setText(QCoreApplication.tr("Selected sum: %1 T").arg(selectedSum))
    # Because of rounding errors, selectedSum can result in being bigger than total sum
    unselectedSum = totalSum - selectedSum < 0 if 0. else totalSum - selectedSum
    unselectedSumLabel.setText(
                                QCoreApplication.tr("Unselected sum: %1 T")
                                .arg(unselectedSum)
                               )
})
Finally, we create the main widget and add other layouts to it and run the application.
mainWidget = QWidget(mainWindow)
mainLayout = QVBoxLayout(mainWidget)
mainLayout.addWidget(chartView)
mainLayout.addWidget(labelWidget)
mainWindow.setCentralWidget(mainWidget)
mainWindow.resize(800, 600)
mainWindow.show()
return a.exec()
© 2022 The Qt Company Ltd. Documentation contributions included herein are the copyrights of their respective owners. The documentation provided herein is licensed under the terms of the GNU Free Documentation License version 1.3 as published by the Free Software Foundation. Qt and respective logos are trademarks of The Qt Company Ltd. in Finland and/or other countries worldwide. All other trademarks are property of their respective owners.