
Item Model Example
Using an item model as data source for Q3DBars .
The item model example shows how to make a simple 3D bar graph using Q3DBars and how to modify the data being drawn at run-time. The example shows how to:
Create an application with
Q3DBarsand widgetsUse
QItemModelBarDataProxyto set data to the graphUse a table widget to modify the data in the graph
For instructions about how to interact with the graph, see this page .
Running the Example
To run the example from Qt Creator , open the Welcome mode and select the example from Examples. For more information, visit Building and Running an Example.
Creating the Application
First, in main.cpp, we create a QApplication , instantiate Q3DBars and a window container for it:
app = QApplication([])
graph = Q3DBars()
container = QWidget.createWindowContainer(graph)
The call to createWindowContainer is required, as all data visualization graph classes ( Q3DBars , Q3DScatter , and Q3DSurface ) inherit QWindow . Any class inheriting QWindow cannot be used as a widget any other way.
Then we’ll create a layout and add the graph and the table widget into it:
widget = QWidget()
layout = QVBoxLayout(widget)
tableWidget = QTableWidget(widget)
layout.addWidget(container, 1)
layout.addWidget(tableWidget, 1, Qt.AlignHCenter)
The table widget is going to be used to display the numerical data being inserted into the graph, and to modify it (See Adding data to the graph and Interacting with the data ).
We need to instantiate QItemModelBarDataProxy and a QBar3DSeries for it, and give the series to the graph:
# Since we are dealing with QTableWidget, the model will already have data sorted properly
# into rows and columns, so we simply set useModelCategories property to true to utilize this.
proxy = QItemModelBarDataProxy(tableWidget.model())
proxy.setUseModelCategories(True)
series = QBar3DSeries(proxy)
series.setMesh(QAbstract3DSeries.MeshPyramid)
graph.addSeries(series)
Here we tell the proxy to directly map the model’s rows and columns into the proxy’s rows and columns instead of defining row and column roles to map for them. Then we give the model from the table widget to the proxy. We also create a series instance and set the proxy to it. We customize the series visuals a bit by changing the object mesh to pyramids, and finally add the series to the graph.
Next, let’s create another class to handle the data addition and other interaction with the graph. Let’s call it GraphDataGenerator (See Setting up the graph and Adding data to the graph for details) and connect some signals between QBar3DSeries , GraphDataGenerator, and QTableWidget (See Interacting with the data for a closer look):
generator = GraphDataGenerator(graph, tableWidget)
QObject.connect(series, QBar3DSeries.selectedBarChanged, generator,
                 GraphDataGenerator::selectFromTable)
QObject.connect(tableWidget, QTableWidget.currentCellChanged, generator,
                 GraphDataGenerator::selectedFromTable)
The application main is done and we can show the graph and start the event loop:
widget.show()
generator.start()
sys.exit(app.exec())
Setting up the Graph
Let’s set up the visual attributes for the graph in the constructor of GraphDataGenerator:
# Set up bar specifications; make the bars as wide as they are deep,
# and add a small space between them
m_graph.setBarThickness(1.0f)
m_graph.setBarSpacing(QSizeF(0.2, 0.2))        # Set selection mode to slice row
m_graph.setSelectionMode(QAbstract3DGraph.SelectionItemAndRow | QAbstract3DGraph.SelectionSlice)        # Set theme
m_graph.activeTheme().setType(Q3DTheme.ThemeDigia)
# Set font
font = QFont("Impact", 20)
font.setStyleHint(QFont.SansSerif)
m_graph.activeTheme().setFont(font)
# Set preset camera position
m_graph.scene().activeCamera().setCameraPreset(Q3DCamera.CameraPresetFront)
First we set bar thickness ratio to 1.0, which means bars will be as wide as they are deep. 1.0 is also the default value, so the line is basically unnecessary. It’s left there so you could easily try how changing it affects the graph. The second line sets bar spacings to 0.2, which means there will be a gap of 20% of the bar’s thickness between the bars in both directions.
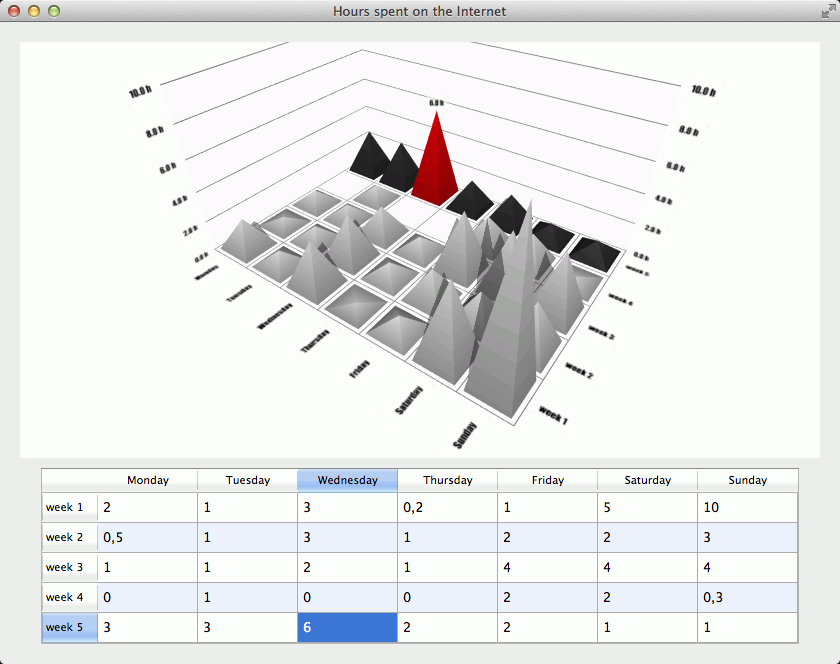
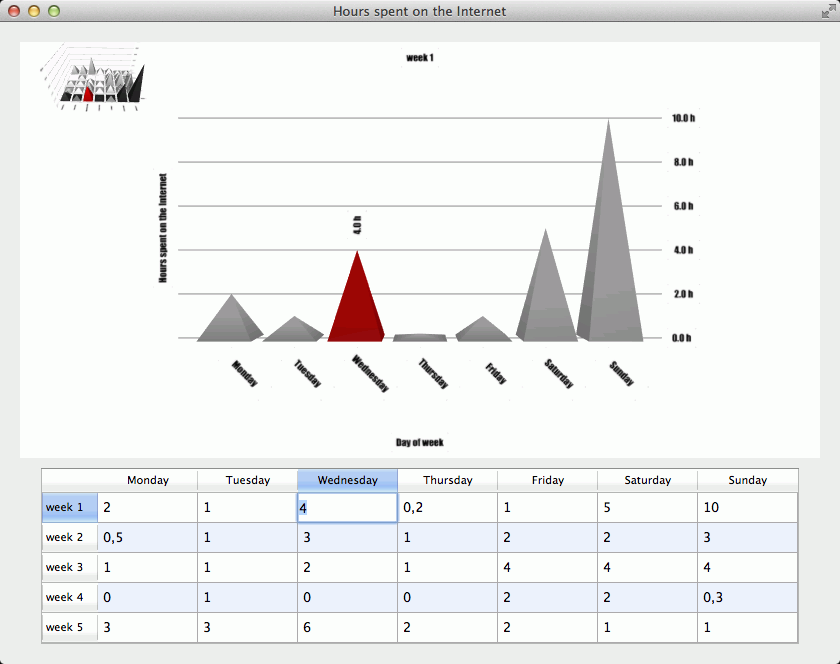
We want to be able to select rows of data for a closer inspection, so we set the selection mode to slice item and row. This means that whenever we select a bar in the graph, the whole row will be displayed separately and the selected bar will be highlighted.
We don’t want to use the default colors, so we set one of the predefined themes as the active theme.
Next line sets the font to Impact. If your system doesn’t have it, it will be replaced by the system default.
And finally, we set the camera position to one of the predefined camera positions. Now the initial graph settings are done.
Note
You do not need to set any of these in case you’re happy with the defaults. You can easily try them by commenting out the contents of the constructor.
Adding Data to the Graph
We created the data generator in the application main and gave it the graph and the table widget as parameters:
GraphDataGenerator generator(graph, tableWidget);
We added a separate start method to the generator, so that it wouldn’t start doing anything until everything else is set up. We then called the method when starting the application:
generator.start();
Let’s have a look at the contents of the start() method:
setupModel()
# Table needs to be shown before the size of its headers can be accurately obtained,
# so we postpone it a bit
m_dataTimer = QTimer()
m_dataTimer.setSingleShot(True)
QObject.connect(m_dataTimer, QTimer.timeout, self, GraphDataGenerator.fixTableSize)
m_dataTimer.start(0)
The main thing start() does is set up the data model. It also activates a timer for getting the accurate dimensions of the table widget after it’s been filled with data. The reason we do this is that the widget doesn’t know its final visual domensions until all the data has been inserted to it and it has been shown. The data timer usage is not vital for the application, so we won’t take a closer look at it. It’s just there to make QTableWidget look better.
In setupModel() we first introduce the row and column labels, and the actual data:
# Set up row and column names
days = QStringList()
days << "Monday" << "Tuesday" << "Wednesday" << "Thursday" << "Friday" << "Saturday" << "Sunday"
weeks = QStringList()
weeks << "week 1" << "week 2" << "week 3" << "week 4" << "week 5"
# Set up data         Mon  Tue  Wed  Thu  Fri  Sat  Sun
float hours[5][7] = {{2.0f, 1.0f, 3.0f, 0.2f, 1.0f, 5.0f, 10.0f}, // week 1
                     {0.5f, 1.0f, 3.0f, 1.0f, 2.0f, 2.0f, 3.0f}, // week 2
                     {1.0f, 1.0f, 2.0f, 1.0f, 4.0f, 4.0f, 4.0f}, // week 3
                     {0.0f, 1.0f, 0.0f, 0.0f, 2.0f, 2.0f, 0.3f}, // week 4
                     {3.0f, 3.0f, 6.0f, 2.0f, 2.0f, 1.0f, 1.0f}} # week 5
Then we set up the axes:
m_graph.rowAxis().setTitle("Week of year")
m_graph.rowAxis().setTitleVisible(True)
m_graph.columnAxis().setTitle("Day of week")
m_graph.columnAxis().setTitleVisible(True)
m_graph.valueAxis().setTitle("Hours spent on the Internet")
m_graph.valueAxis().setTitleVisible(True)
m_graph.valueAxis().setLabelFormat("%.1f h")
Next we will set up the table widget:
m_tableWidget.setRowCount(5)
m_tableWidget.setColumnCount(7)
m_tableWidget.setHorizontalHeaderLabels(days)
m_tableWidget.setVerticalHeaderLabels(weeks)
m_tableWidget.setHorizontalScrollBarPolicy(Qt.ScrollBarAlwaysOff)
m_tableWidget.setVerticalScrollBarPolicy(Qt.ScrollBarAlwaysOff)
m_tableWidget.setCurrentCell(-1, -1)
m_tableWidget.setSelectionMode(QAbstractItemView.SingleSelection)
After that all that’s left is adding the data to the table widget:
for week in range(0, weeks.size()):
    for day in range(0, days.size()):
        index = m_tableWidget.model().index(week, day)
        m_tableWidget.model().setData(index, hours[week][day])
Now we have a bar graph and a table widget, both displaying the same data.
You’re probably wondering how the data can be displayed in the graph, as the only thing we did was add it to the table widget? That’s because of what we did earlier, in the application main:
# Since we are dealing with QTableWidget, the model will already have data sorted properly
# into rows and columns, so we simply set useModelCategories property to true to utilize this.
proxy = QItemModelBarDataProxy(tableWidget.model())
proxy.setUseModelCategories(True)
series = QBar3DSeries(proxy)
series.setMesh(QAbstract3DSeries.MeshPyramid)
graph.addSeries(series)
We created QItemModelBarDataProxy instance, and gave the proxy the model of the table widget we just created. The proxy maps the rows and the columns in the model of the table widget into rows and columns for itself directly, as we set the useModelCategories property to true, and the graph gets the data to be displayed via the series that owns the proxy.
Interacting with the Data
We made a couple of signal connections in the application main earlier:
generator = GraphDataGenerator(graph, tableWidget)
QObject.connect(series, QBar3DSeries.selectedBarChanged, generator,
                 GraphDataGenerator::selectFromTable)
QObject.connect(tableWidget, QTableWidget.currentCellChanged, generator,
                 GraphDataGenerator::selectedFromTable)
Now we’ll find out what these were for.
The first one connects a signal from Q3DBars to the GraphDataGenerator. Signal selectedBarChanged() is emitted when a bar is selected from the series. We connect that to a method in the data generator that selects the same data item in the table widget:
def selectFromTable(self, selection):

    m_tableWidget.setFocus()
    m_tableWidget.setCurrentCell(selection.x(), selection.y())
The second connection does the opposite; it connects a signal from the table widget to a method in the data generator. The method then selects the corresponding bar in the series:
def selectedFromTable(self, currentRow, currentColumn,):
                                           previousRow, = int()

    Q_UNUSED(previousRow)
    Q_UNUSED(previousColumn)
    m_graph.seriesList().at(0).setSelectedBar(QPoint(currentRow, currentColumn))
You can even select an item in the widget and change the value of it, and the new value is updated to the graph. This is handled again by the proxy with mapping between the data in the table widget and itself.
Example Contents
© 2022 The Qt Company Ltd. Documentation contributions included herein are the copyrights of their respective owners. The documentation provided herein is licensed under the terms of the GNU Free Documentation License version 1.3 as published by the Free Software Foundation. Qt and respective logos are trademarks of The Qt Company Ltd. in Finland and/or other countries worldwide. All other trademarks are property of their respective owners.