Qt Quick 2 Oscilloscope Example
Example of a hybrid C++ and QML application.
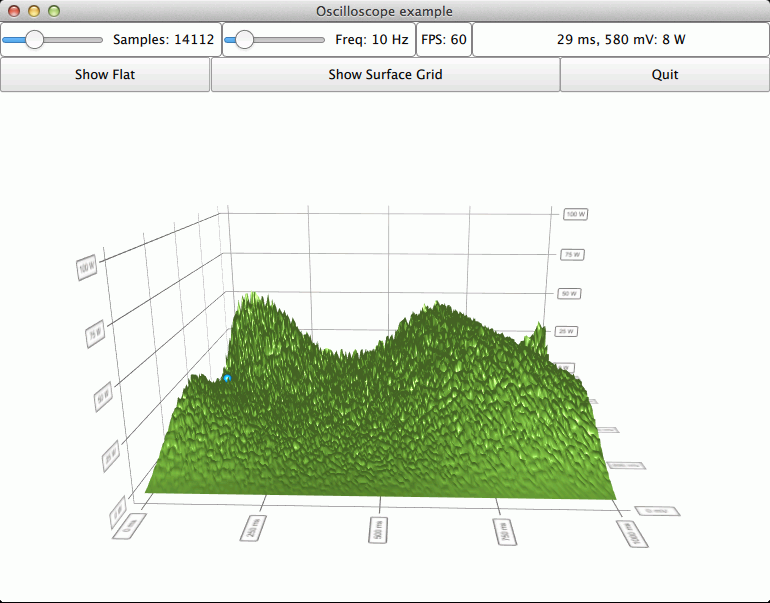
The Qt Quick 2 oscilloscope example shows how to combine C++ and QML in an application, as well as showing data that changes realtime.
The interesting thing about this example is combining C++ and QML, so we’ll concentrate on that and skip explaining the basic functionality - for more detailed QML example documentation, see Qt Quick 2 Scatter Example .
Running the Example
To run the example from Qt Creator , open the Welcome mode and select the example from Examples. For more information, visit Building and Running an Example.
Data Source in C++
The item model based proxies are good for simple and/or static graphs, but to achieve best performance when displaying data changing in realtime, the basic proxies should be used. Those are not supported in QML, as the data items they store are not QObject s and cannot therefore be directly manipulated from QML code. To overcome this limitation, we implement a simple DataSource class in C++ to populate the data proxy of the series.
The DataSource class provides three methods that can be called from QML:
Q_SLOTS: = public()
    def generateData(cacheCount, rowCount, columnCount,):
                      xMin, = float()
    def update(series):
The first method, generateData(), creates a cache of simulated oscilloscope data for us to display. The data is cached in a format accepted by QSurfaceDataProxy :
def generateData(self, cacheCount, rowCount, columnCount,):
                              xMin, = float()
                              zMin, = float()

    if (not cacheCount or not rowCount or not columnCount)
        return
    clearData()
    # Re-create the cache array
    m_data.resize(cacheCount)
        for (int i(0); i < cacheCount; i++) {
        QSurfaceDataArray array = m_data[i]
        array.reserve(rowCount)
                for (int j(0); j < rowCount; j++)
            array.append(QSurfaceDataRow(columnCount))

    xRange = xMax - xMin
    yRange = yMax - yMin
    zRange = zMax - zMin
    cacheIndexStep = columnCount / cacheCount
    cacheStep = float(cacheIndexStep) * xRange / float(columnCount)
    # Populate caches
        for (int i(0); i < cacheCount; i++) {
        QSurfaceDataArray cache = m_data[i]
        cacheXAdjustment = cacheStep * i
        cacheIndexAdjustment = cacheIndexStep * i
                for (int j(0); j < rowCount; j++) {
            QSurfaceDataRow row = *(cache[j])
            rowMod = (float(j)) / float(rowCount)
            yRangeMod = yRange * rowMod
            zRangeMod = zRange * rowMod
            z = zRangeMod + zMin
            rowColWaveAngleMul = M_PI * M_PI * rowMod()
            rowColWaveMul = yRangeMod * 0.2f
                        for (int k(0); k < columnCount; k++) {
                colMod = (float(k)) / float(columnCount)
                xRangeMod = xRange * colMod
                x = xRangeMod + xMin + cacheXAdjustment
                colWave = float(qSin((2.0 * M_PI * colMod) - (1.0 / 2.0 * M_PI)) + 1.0)
                y = (colWave * ((float(qSin(rowColWaveAngleMul * colMod) + 1.0))))
                        * rowColWaveMul
                        + QRandomGenerator.global().bounded(0.15f) * yRangeMod
                index = k + cacheIndexAdjustment
                if (index >= columnCount) {
                    # Wrap over
                    index -= columnCount
                    x -= xRange

                row[index] = QVector3D(x, y, z)
The second method, update(), copies one set of the cached data into another array, which we set to the data proxy of the series by calling resetArray() . We reuse the same array if the array dimensions have not changed to minimize overhead:
def update(self, series):

    if (series and m_data.size()) {
        # Each iteration uses data from a different cached array
        m_index = m_index + 1
        if (m_index > m_data.count() - 1)
            m_index = 0
        array = m_data.at(m_index)
        newRowCount = array.size()
        newColumnCount = array.at(0).size()
        # If the first time or the dimensions of the cache array have changed,
        # reconstruct the reset array
        if (not m_resetArray or series.dataProxy().rowCount() not = newRowCount
                or series.dataProxy().columnCount() != newColumnCount) {
            m_resetArray = QSurfaceDataArray()
            m_resetArray.reserve(newRowCount)
                        for (int i(0); i < newRowCount; i++)
                m_resetArray.append(QSurfaceDataRow(newColumnCount))

        # Copy items from our cache to the reset array
                for (int i(0); i < newRowCount; i++) {
            QSurfaceDataRow sourceRow = *(array.at(i))
            QSurfaceDataRow row = *(*m_resetArray)[i]
                        for (int j(0); j < newColumnCount; j++)
                row[j].setPosition(sourceRow.at(j).position())

        # Notify the proxy that data has changed
        series.dataProxy().resetArray(m_resetArray)
Note
Even though we are operating on the array pointer we have previously set to the proxy we still need to call resetArray() after changing the data in it to prompt the graph to render the data.
To be able to access the DataSource methods from QML, we need to expose it. We do this by defining a context property in application main:
dataSource = DataSource()
viewer.rootContext().setContextProperty("dataSource", dataSource)
To make it possible to use QSurface3DSeries pointers as parameters on the DataSource class methods on all environments and builds, we need to make sure the meta type is registered:
Q_DECLARE_METATYPE(QSurface3DSeries *)        ...
qRegisterMetaType<QSurface3DSeries *>()
QML
In the QML codes, we define a Surface3D graph normally and give it a Surface3DSeries :
Surface3DSeries {
    id: surfaceSeries
    drawMode: Surface3DSeries.DrawSurface;
    flatShadingEnabled: false;
    meshSmooth: true
    itemLabelFormat: "@xLabel, @zLabel: @yLabel"
    itemLabelVisible: false

    onItemLabelChanged: {
        if (surfaceSeries.selectedPoint === surfaceSeries.invalidSelectionPosition)
            selectionText.text = "No selection"
        else
            selectionText.text = surfaceSeries.itemLabel
    }
}
One interesting detail is that we don’t specify a proxy for the Surface3DSeries we attach to the graph. This makes the series to utilize the default QSurfaceDataProxy .
We also hide the item label with itemLabelVisible , since we want to display the selected item information in a Text element instead of a floating label above the selection pointer. This is done because the selection pointer moves around a lot as the data changes, which makes the regular selection label difficult to read.
We initialize the DataSource cache when the graph is complete by calling a helper function generateData(), which calls the method with the same name on the DataSource:
Component.onCompleted: mainView.generateData()            ...
function generateData() {
    dataSource.generateData(mainView.sampleCache, mainView.sampleRows,
                            mainView.sampleColumns, surfaceGraph.axisX.min,
                            surfaceGraph.axisX.max, surfaceGraph.axisY.min,
                            surfaceGraph.axisY.max, surfaceGraph.axisZ.min,
                            surfaceGraph.axisZ.max)
}
To trigger the updates in data, we define a Timer item which calls the update() method on the DataSource at requested intervals. The label update is also triggered on each cycle:
Timer {
    id: refreshTimer
    interval: 1000 / frequencySlider.value
    running: true
    repeat: true
    onTriggered: dataSource.update(surfaceSeries)
}
Enabling Direct Rendering
Since this application potentially deals with a lot of rapidly changing data, we use direct rendering mode for performance. To enable antialiasing in this mode the surface format of the application window needs to be changed, as the default format used by QQuickView doesn’t support antialiasing. We use the utility function provided by Qt Data Visualization to change the surface format in main.cpp:
viewer.setFormat(qDefaultSurfaceFormat(True)) ...
© 2022 The Qt Company Ltd. Documentation contributions included herein are the copyrights of their respective owners. The documentation provided herein is licensed under the terms of the GNU Free Documentation License version 1.3 as published by the Free Software Foundation. Qt and respective logos are trademarks of The Qt Company Ltd. in Finland and/or other countries worldwide. All other trademarks are property of their respective owners.

