
Textured Surface Example
Using texture with Q3DSurface .
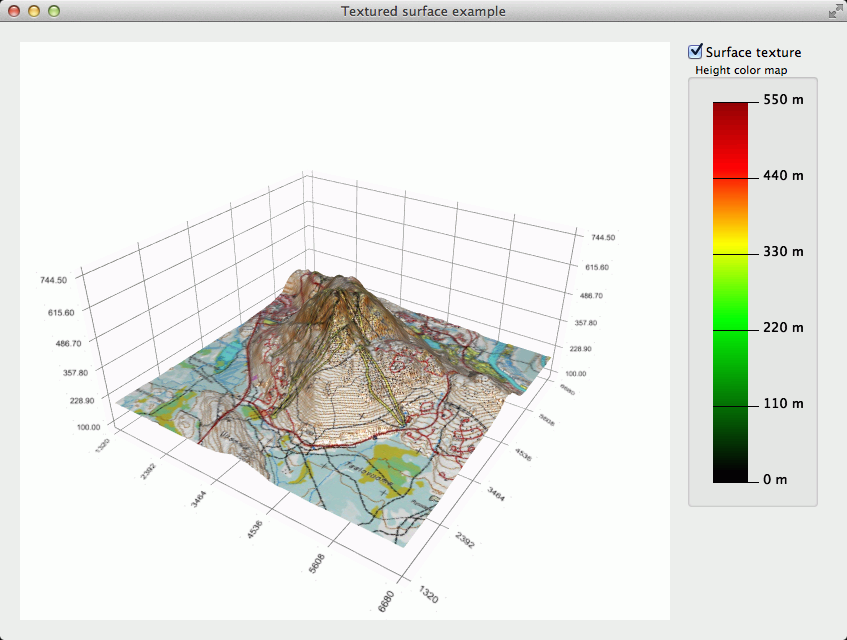
The textured surface example shows how to add an image as a texture for a surface. The example shows also how to:
Create a surface series from an image
Use custom input handler to enable zooming and panning
Highlight an area of the surface
Running the Example
To run the example from Qt Creator , open the Welcome mode and select the example from Examples. For more information, visit Building and Running an Example.
Texture to a Surface Series
The image to be set as a texture to a surface can be set using setTextureFile() . In this example we have added a check box to control if the texture is set or not. The following code extract is for reacting to the check box selections. The image in this example is read from the resource file where it is as a JPG file. Setting an empty file with the method clears the texture, and the surface uses the gradients or colors from the theme.
def toggleSurfaceTexture(self, enable):

    if (enable)
        m_topography.setTextureFile(":/maps/maptexture")
else:
        m_topography.setTextureFile("")
Topographic Surface Series
The topographic data for this example is obtained from National Land Survey of Finland. It provides a product called Elevation Model 2 m, which was suitable for our needs. We selected Levi fell to be shown. The accuracy of the data was well beyond our needs and therefore it is compressed and encoded into a PNG file. The height value from the original ASCII data is encoded into RGB format using a multiplier, which you will see later on a code extract. The multiplier is calculated simply by dividing the largest 24 bit value with the highest point in Finland.
Qt Data Visualization has a special proxy for height map image files, but it converts only one byte values. So to utilize the bigger accuracy on the data from National Land Survey of Finland, we read the data from the PNG file and decode it into QSurface3DSeries . The following code samples show how this is done.
First the encoding multiplier.
# Value used to encode height data as RGB value on PNG file
packingFactor = 11983.0f
And then the actual decoding.
heightMapImage = QImage(file)
bits = heightMapImage.bits()
imageHeight = heightMapImage.height()
imageWidth = heightMapImage.width()
widthBits = imageWidth * 4
stepX = width / float(imageWidth)
stepZ = height / float(imageHeight)
dataArray = QSurfaceDataArray()
dataArray.reserve(imageHeight)
for i in range(0, imageHeight):
    p = i * widthBits
    z = height - float(i) * stepZ
    newRow = QSurfaceDataRow(imageWidth)
    for j in range(0, imageWidth):
        aa = bits[p + 0]
        rr = bits[p + 1]
        gg = bits[p + 2]
        color = uint((gg << 16) + (rr << 8) + aa)
        y = float(color) / packingFactor
        (newRow)[j].setPosition(QVector3D(float(j)  stepX, y, z))
        p = p + 4

    dataArray << newRow

dataProxy().resetArray(dataArray)
Use Custom Input Handler to Enable Zooming and Panning
For the panning the implementation is similar to the Axis Range Dragging With Labels Example . The difference is that in this example we follow only dragging of X and Z axis and we don’t allow dragging the surface outside the graph. The control for this is very simple and done as on the following example for the X axis.
StateDraggingX: = case()
    distance = (move.x() * xMulX - move.y() * xMulY) * m_speedModifier
    m_axisXMinValue -= distance
    m_axisXMaxValue -= distance
    if (m_axisXMinValue < m_areaMinValue) {
        dist = m_axisXMaxValue - m_axisXMinValue
        m_axisXMinValue = m_areaMinValue
        m_axisXMaxValue = m_axisXMinValue + dist

    if (m_axisXMaxValue > m_areaMaxValue) {
        dist = m_axisXMaxValue - m_axisXMinValue
        m_axisXMaxValue = m_areaMaxValue
        m_axisXMinValue = m_axisXMaxValue - dist

    m_axisX.setRange(m_axisXMinValue, m_axisXMaxValue)
    break
For the zooming we catch the wheelEvent and adjust the X and Y axis ranges according to delta value on QWheelEvent . The Y axis is also adjusted so that the aspect ratio between Y axis and XZ plane stays the same, and we don’t get silly looking graph with height exaggerated too much.
def wheelEvent(self, event):

    delta = float(event.angleDelta().y())
    m_axisXMinValue += delta
    m_axisXMaxValue -= delta
    m_axisZMinValue += delta
    m_axisZMaxValue -= delta
    checkConstraints()
    y = (m_axisXMaxValue - m_axisXMinValue) * m_aspectRatio
    m_axisX.setRange(m_axisXMinValue, m_axisXMaxValue)
    m_axisY.setRange(100.0f, y)
    m_axisZ.setRange(m_axisZMinValue, m_axisZMaxValue)
In this case we want to control the zoom level so that it won’t get too near to or far from the surface. For instance, if the value for the X axis gets below the allowed, i.e. zooming gets too far, the value is set to the minimum allowed value. If the range is going to below the range minimum, both ends of the axis are adjusted so that the range stays at the limit.
if (m_axisXMinValue < m_areaMinValue)
    m_axisXMinValue = m_areaMinValue
if (m_axisXMaxValue > m_areaMaxValue)
    m_axisXMaxValue = m_areaMaxValue
# Don't allow too much zoom in
if ((m_axisXMaxValue - m_axisXMinValue) < m_axisXMinRange) {
    adjust = (m_axisXMinRange - (m_axisXMaxValue - m_axisXMinValue)) / 2.0f
    m_axisXMinValue -= adjust
    m_axisXMaxValue += adjust
Highlight an Area of the Surface
The main idea on creating a highlight on the surface is to create a copy of the series and add a bit of offset to the y value. On this example the class HighlightSeries implements the creation of the copy on its handlePositionChange method. Firstly the HighlightSeries needs to get the pointer to the original series and then it starts to listen the selectedPointChanged signal.
def setTopographicSeries(self, series):

    m_topographicSeries = series
    m_srcWidth = m_topographicSeries.dataProxy().array().at(0).size()
    m_srcHeight = m_topographicSeries.dataProxy().array().size()
    QObject.connect(m_topographicSeries, QSurface3DSeries.selectedPointChanged,
                     self, HighlightSeries::handlePositionChange)
When the signal arrives, first thing is to check that the position is valid. Then the ranges for the copied area are calculated and checked that they stay within the bounds. Finally we simply fill the data array of the highlight series with the range from the data array of topography series.
def handlePositionChange(self, position):

    m_position = position
    if (position == invalidSelectionPosition()) {
        setVisible(False)
        return

    halfWidth = m_width / 2
    halfHeight = m_height / 2
    startX = position.y() - halfWidth
    if (startX < 0 )
        startX = 0
    endX = position.y() + halfWidth
    if (endX > (m_srcWidth - 1))
        endX = m_srcWidth - 1
    startZ = position.x() - halfHeight
    if (startZ < 0 )
        startZ = 0
    endZ = position.x() + halfHeight
    if (endZ > (m_srcHeight - 1))
        endZ = m_srcHeight - 1
    srcProxy = m_topographicSeries.dataProxy()
    QSurfaceDataArray srcArray = srcProxy.array()
    dataArray = QSurfaceDataArray()
    dataArray.reserve(endZ - startZ)
    for i in range(startZ, endZ):
        newRow = QSurfaceDataRow(endX - startX)
        srcRow = srcArray.at(i)
        for j in range(startX, endX):
            pos = srcRow.at(j).position()
            (newRow)[p].setPosition(QVector3D(pos.x(), pos.y() + 0.1f, pos.z()))

        dataArray << newRow

    dataProxy().resetArray(dataArray)
    setVisible(True)
A Gradient to the Highlight Series
Since the HighlightSeries is QSurface3DSeries , we can use all the decoration methods series can have. In this example we added a gradient to emphasize the elevation. Because the suitable gradient style depends on the range of the Y axis and we change the range when zooming, we need to adjust the gradient color positions as the range change.
For the gradient color positions we define proportional values.
darkRedPos = 1.0f
redPos = 0.8f
yellowPos = 0.6f
greenPos = 0.4f
darkGreenPos = 0.2f
The gradient modification is done on handleGradientChange method and we connect it to react to changes on Y axis.
QObject.connect(m_graph.axisY(), QValue3DAxis.maxChanged,
                 m_highlight, HighlightSeries::handleGradientChange)
When a change on Y axis max value happens, we calculate the gradient color positions.
def handleGradientChange(self, value):

    ratio = m_minHeight / value
    gr = QLinearGradient()
    gr.setColorAt(0.0f, Qt.black)
    gr.setColorAt(darkGreenPos * ratio, Qt.darkGreen)
    gr.setColorAt(greenPos * ratio, Qt.green)
    gr.setColorAt(yellowPos * ratio, Qt.yellow)
    gr.setColorAt(redPos * ratio, Qt.red)
    gr.setColorAt(darkRedPos * ratio, Qt.darkRed)
    setBaseGradient(gr)
    setColorStyle(Q3DTheme.ColorStyleRangeGradient)
© 2022 The Qt Company Ltd. Documentation contributions included herein are the copyrights of their respective owners. The documentation provided herein is licensed under the terms of the GNU Free Documentation License version 1.3 as published by the Free Software Foundation. Qt and respective logos are trademarks of The Qt Company Ltd. in Finland and/or other countries worldwide. All other trademarks are property of their respective owners.